The following Full Page Check or transaction browser types support a number of extra metrics and features:
- Chrome with extra metrics
- Microsoft Edge
Chrome with extra metrics supports Core Web Vitals and W3C navigation timings for transaction monitoring.
Features
Native checks
For the supported browser types, the FPC measures performance directly within the browser. This allows the browser to function as close to natural as possible.
HTTP2, HTTP3, QUIC support and headers
In addition to the HTTP protocol, the HTTP2, HTTP3 and QUIC protocol are supported.
Requests done by a protocol such as HTTP2, HTTP3 and QUIC will have different headers than with the HTTP protocol. There are no X-Uptrends headers, such as X-Uptrends-PortInfo and X-Blocked-By-Uptrends.
Content match
Only the final result is considered when matching HTML content. Content shown during a redirect will not trigger a content match.
URL blocking
When navigating to a site, the navigate will succeed, even if the URL of that site is listed in the blocked URLs list. An FPC of a browser type with extra metrics does not block navigation. Other elements that the site references such as images will be blocked, though.
Cached elements
Because Uptrends extracts performance information from the browser, cached elements can be shown. It is possible to filter them if so desired.
DNS bypass
You can choose to add a DNS bypass. A Full Page Check loads your page using an actual browser, downloads each element and subsequently displays a waterfall chart to inspect those elements. The DNS bypass makes sure the web page is resolved to a domain name or IP address you’ve specified. This DNS override is also available for Transactions.
Metrics
Measuring techniques
The results (timings and total bytes) in a browser type with extra metrics vs other browser types are different.
The FPC (browser types with extra metrics) supports new protocols such as HTTP2 and HTTP3, and is closely integrated with the browser. As a result, the waterfall generated can differ from that of an FPC with another browser type. You can expect to see more simultaneous requests, that transfer more quickly. Because the measurement can be quicker or slower, the total bytes could also differ, because Uptrends captures a different amount of background activity after the page load (e.g. a video that is loading, or a JavaScript serviceworker that is performing background tasks).
Core Web Vitals
Core Web Vitals are standard metrics from Google that are used to understand the performance of your website. Uptrends measures and reports those metrics in the check results. You can show the results on a dashboard by using a custom report tile of the type Simple data list / chart and choosing from the list of Core Web Vitals data.
Those measurements may be different than what is measured with the Lighthouse tool. The Lighthouse tool provided by Google uses a different measuring technique than Uptrends. We run a browser that visits a website just like a normal user would. The Lighthouse tool first runs a warmup and then visits the site several times to determine an average. The Lighthouse tool also does not trigger certain user input checks, that our measuring technique and normal users do. It also simulates a slower connection with throttling. This is why the Core Web Vitals reported by Lighthouse can differ from Uptrends measurements.
Please visit the article on Core Web Vitals to learn all about these metrics.
W3C metrics
The Word Wide Web Consortium (W3C) has defined a set of navigation timings that are essential to loading a web page. Uptrends has adopted several of those timings to measure and show in reports. You can show the results on a dashboard by using a custom report tile of the type Simple data list / chart and choosing from the list of W3C navigation timing data.
Check out the knowledge base article W3C navigation timings to find out the details about the implemented navigation timings.
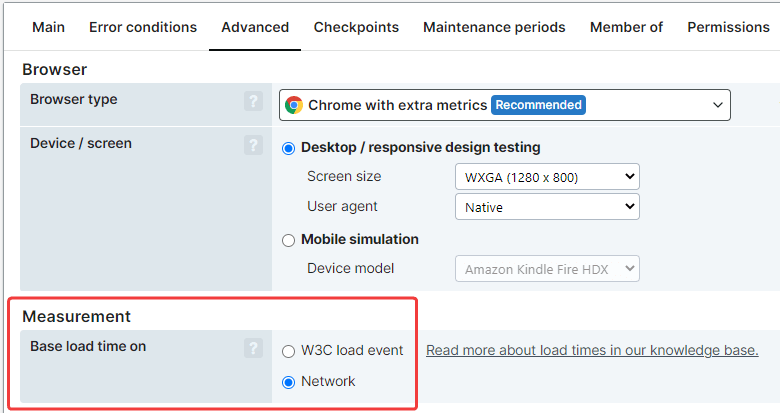
Core Web Vitals and W3C navigation timings are available for your transactions as well. To enable these extra metrics for transaction monitoring, select Chrome with extra metrics from the Browser type drop-down in the Advanced tab in the monitor settings. You can find the additional metrics included in the transaction waterfall, in steps for which a waterfall has been enabled. (Available for Business- and Enterprise-level accounts only.)
Load time: W3C total time or Network time
A Full Page Check monitor or transaction monitor with the browser type with extra metrics provides the options to measure the load time based on the W3C load event or the Network time.
W3C total time
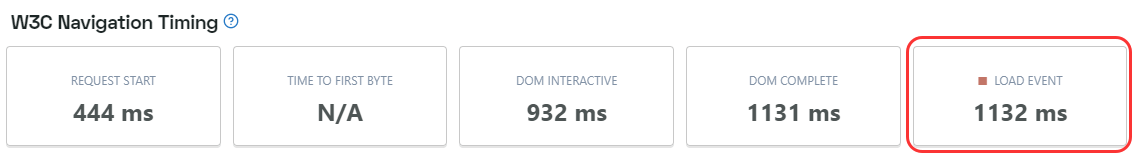
When choosing the W3C total time for measurements, the W3C load event end metric is used. The W3C load event is described in further detail in https://www.w3.org/TR/navigation-timing/#dom-performancetiming-loadend.
In the Uptrends app, this metric is not calculated but it comes directly from the browser, more specifically from the browser’s Developer tools.
You can find the results of the measurement in the check details of the monitor. Look at the Load Event of the W3C Navigation Timing metrics.
Network time
The Network time is measured by waiting for an idle period of network activity.
Setting the load time basis for a monitor
To make your choice, go to the Advanced tab of the monitor settings. In the Measurement section select one of the options for the Base load time on:
Metrics differences and suggestions on which setting to choose
There can be quite a big difference between measuring the load time with either W3C load time or Network time. The results (and differences) depend heavily on what is monitored, e.g. for a transaction that uses the W3C load event the individual step load times change when using a different method, therefore the total time changes.
In a Full Page Check monitor you may see more than one navigate action, e.g. when there are redirects in place. The metrics are recorded per navigate and summed up for the complete metric W3C load event.
In a transaction monitor you could have several navigations within one step, i.e. several navigation actions or a navigation that triggers other navigations. The load times are summed up per step and are then summed up for the whole transaction to the metric total time. An exception applies: if there is no navigation in the step, but e.g. a content check, the time for that step is 0 (other than when using Network time). In this case, network time is not the idle period of network activity but is derived from the execution time of the steps.
Here are some hints on how to choose the optimal method for transactions:
- If you want to know how quickly your page loads - in other words you are interested purely in the loading - then W3C load time is the recommended choice.
- If you want to know more about the end user experience, e.g. how long does it take a user to go through the whole transaction, the use of the Network time is recommended. The reason is that it takes everything into account, also steps that are not navigates but still influence the time the user needs to complete the transaction.
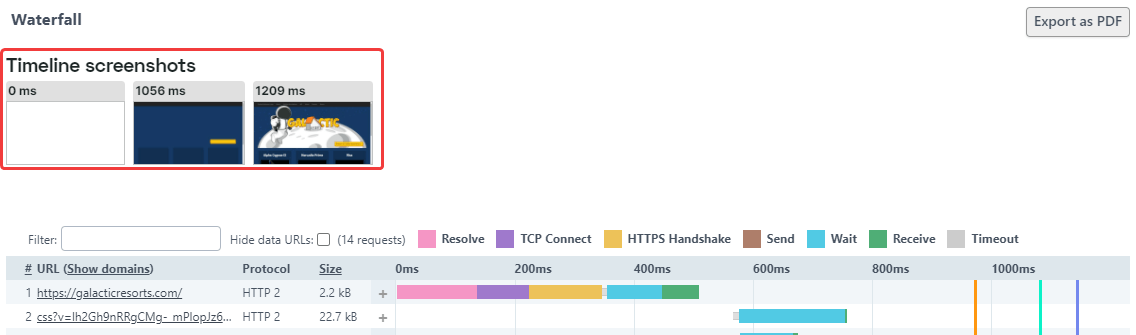
Timeline screenshots
The timeline of screenshots (aka filmstrip) contains a number of screenshots that are taken while the monitored webpage is loading. The timeline is presented above the waterfall in the monitor check details:
Data URLs in waterfall
Elements that are embedded inside the HTML document, such as data URLs, or that come from JavaScript, such as Blob URLs, are also shown in the waterfall. You can apply a filter if needed.
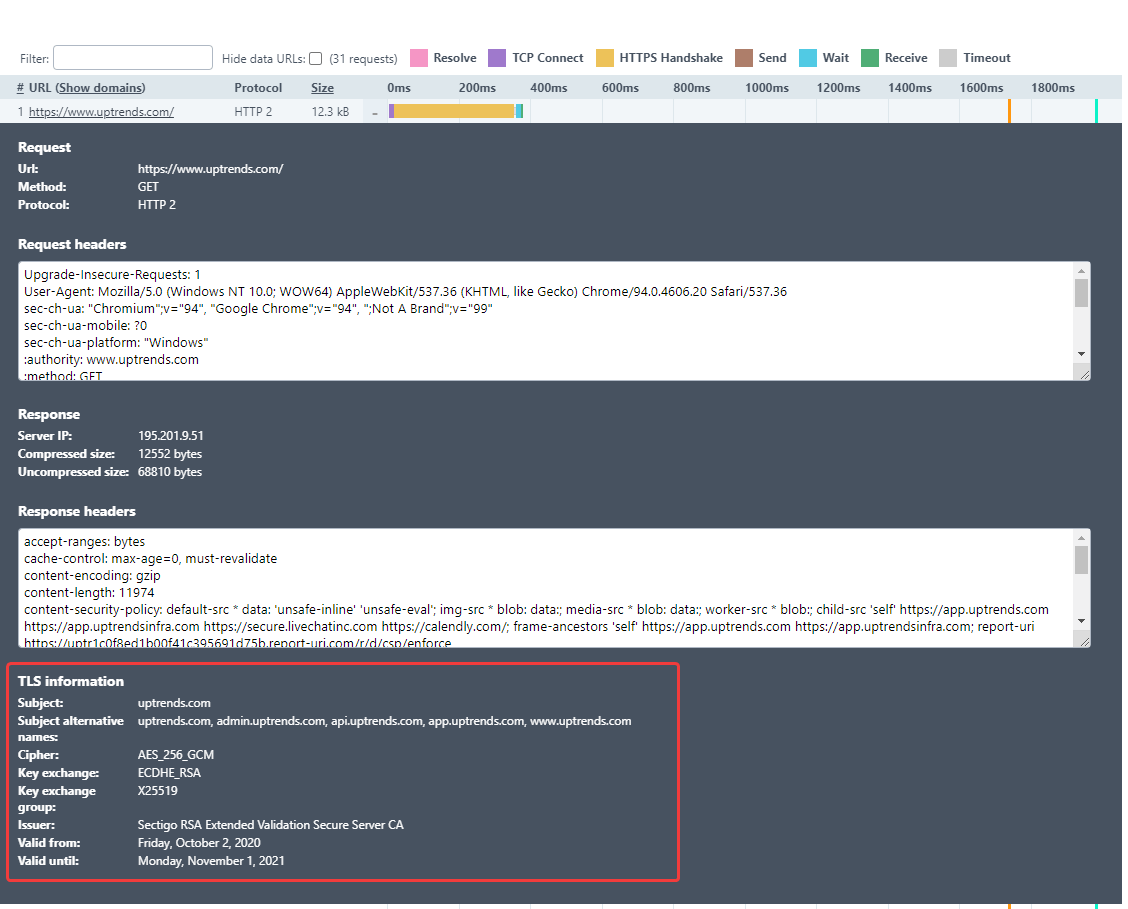
TLS information
In the waterfall of the monitor check details you can find TLS information for each element. You can open the details from the waterfall by clicking on the plus sign next to the element: