
For concurrent monitoring, the check results are built up differently than those for a standard monitor setup. There are several aspects to the concurrent check results that set them apart from standard monitor results. A concurrent monitor result consists of several individual checks, each with their own metrics and outcomes. In this article, we’ll go over how to interpret the check details to make the most of your concurrent monitors. If you’re looking to get started with concurrent monitoring, we have a guide on how to set it up available here.
Identifying concurrent monitor results
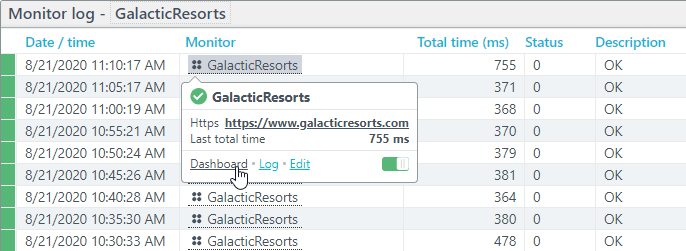
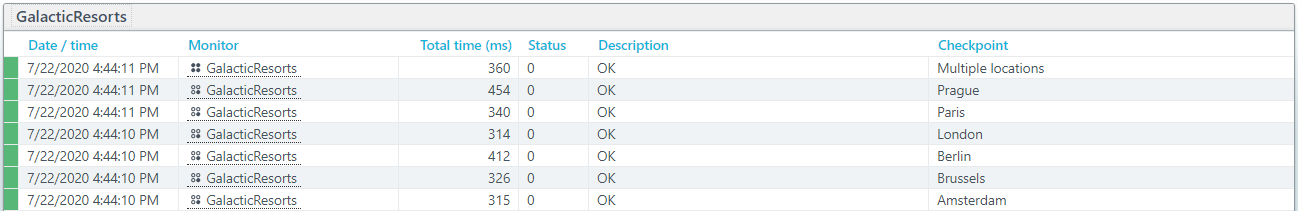
In the monitor log, you can identify concurrent monitor check results by the  icon. These results do not list any checkpoint under the Checkpoint column, but instead list Multiple locations. Alternatively, each concurrent monitor has its own special dashboard, which displays relevant information regardless of the monitor type. To reach the concurrent monitor dashboard, hover over the QuickInfo tag of a monitor check result and on the appearing QuickInfo panel click Dashboard.
Interpreting the concurrent monitoring results
To open the overall monitor check, simply click its entry in the monitor log.
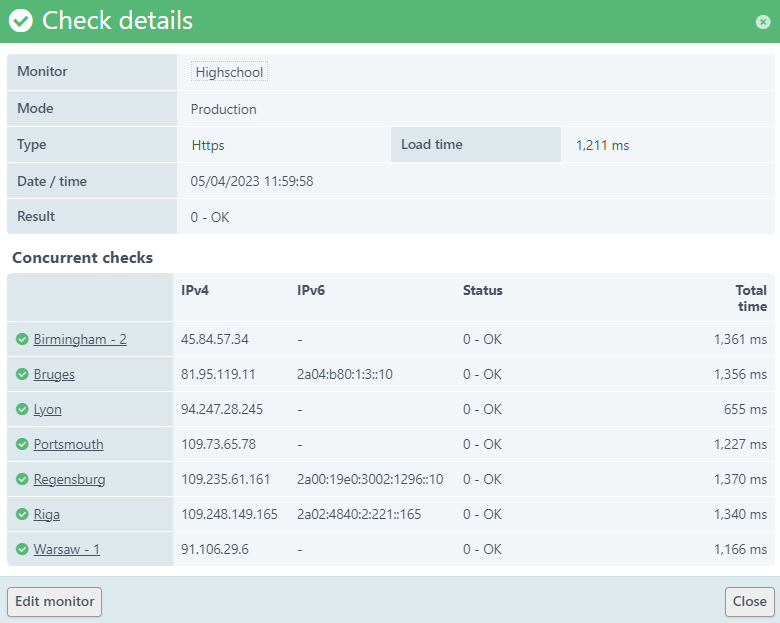
As you can see, the detail popup window for the overall check lists those checkpoints that executed the check. The displayed Load time metric is the average of the load times from the individual checks, from each individual checkpoint. The Result shown is the overall check result - if the overall check meets the conditions set out in the monitor settings, we’ll report a result code 0 - OK. Otherwise, we’ll report an error. Errors work slightly differently for concurrent monitoring - we’ve written up a complete explanation here.
For more details about the individual measurements we executed to get to this overall result, you can find the detailed overview for the individual measurements by clicking the checkpoint names. As an example, if we click Birmingham - 2 in the previous screenshot, we can view the details check results that were executed from the Birmingham-2 checkpoint.
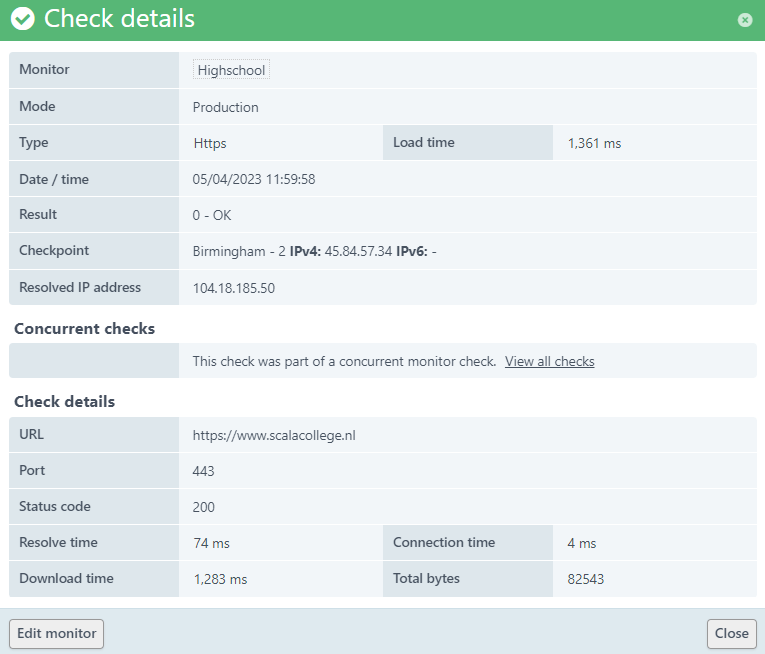
This overview contains information such as the detailed total time breakdown for the check executed from that specific checkpoint. As you can see, it also contains a link that will take you back to the overall check ( View all checks).
Displaying individual checks in the monitor log
By default, the monitor log displays only the overall checks. To find the details on the individual measurements, you’d have to go through the overall check popup as previously described. However, you can set up your monitor log to display both the overall checks and each individual check. To set this up, set the dashboard filter in the top right to Show partial checks.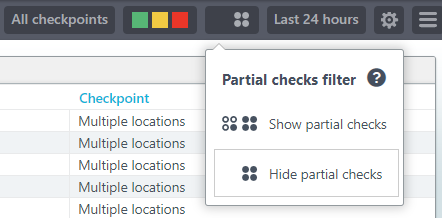
Alternatively, click the cog icon in the top right of the monitor log tile (you may have to mouse over the tile before this icon appears), and tick the Show partial measurements option. Save the configuration by clicking the button in the bottom right of the options flyout menu.
As you can see, the monitor log now contains both the overall measurements (as indicated by the icon), which lists Multiple locations, and each individual check listing their respective checkpoints. The same information is displayed in the available error breakdown tiles.