
The waterfall chart is a visual representation of the monitor check results related to the loading of page elements. The waterfall is part of the check details.
For Full Page Checks (FPCs), the waterfall is generated by default. For transaction monitors you can decide per step if you want to add a waterfall and the knowledge base article Using transaction screenshots and waterfalls tells you more about how to do that.
Using waterfall charts for debugging
It is one thing to see the page’s load time, but the waterfall breaks down your page load-time performance for every element.
- See the resolve, TCP connect, HTTPS handshake, send, wait, receive, and timeout time for each element. The timings are further explained in the knowledge base article Waterfall timings.
- View the page load progression. It is easy to spot slow and page-blocking elements in the waterfall chart.
- Find failed page elements. You can examine the request and response headers for clues about the failure. For example, you can identify whether a CDN node sent the wrong content or the response was too slow.
Where is the waterfall chart located?
For both FPCs and transaction monitors, the waterfalls are located in the check details, but accessing it slightly differs. Take the steps explained below.
Opening an FPC waterfall
To open the waterfall report, you have to open the monitor check details. Follow these steps:
-
Go to the Monitor log dashboard. You can get there quickly by entering “Monitor log” in the menu search bar.
-
Open one of the FPC monitor checks by clicking on the row.
-
The check details will open, with the waterfall report at the bottom.
Opening a transaction monitor step waterfall
The waterfall report is inside the monitor check details.
-
Go to the Monitor log and open a transaction monitor check.
-
At the bottom you find the Results per step. Click the waterfall icon to open the waterfall details.
Waterfall chart example
Once you’ve opened the waterfall, the chart will look similar to this one:
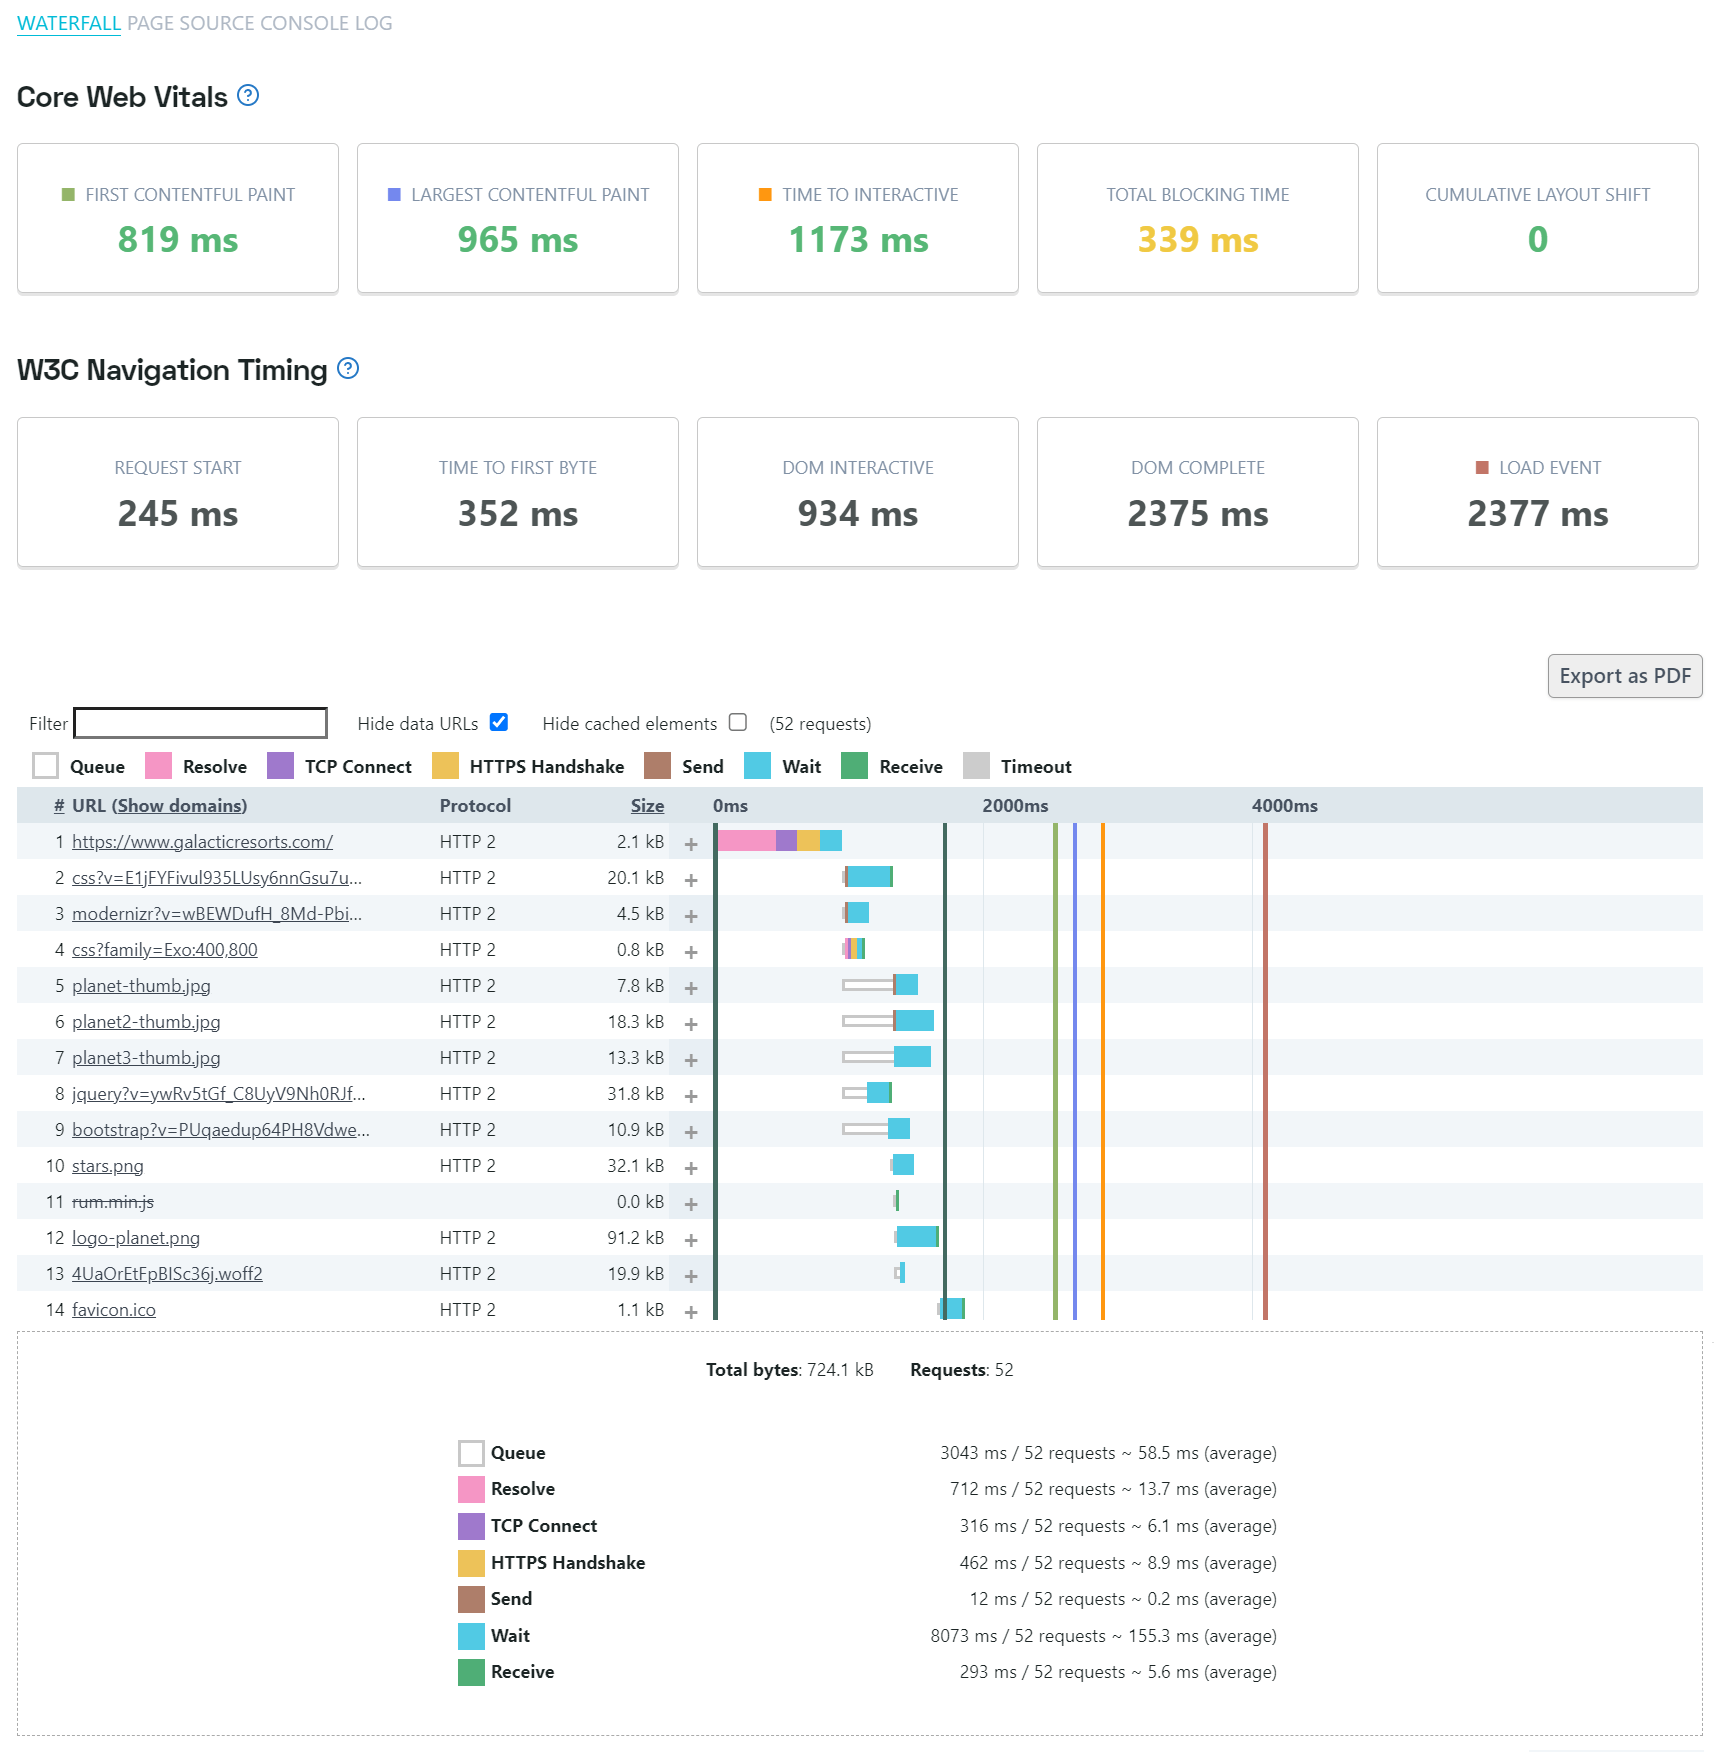
What is presented in the waterfall chart?
The waterfall chart shows the names (URLs) of the page elements in the first column, then the size of the page element and the loading time measurements, taken during the monitor check, for all page elements that were loaded. The measurements are shown chronologically from left to right with one row for each page element. To load a page element a number of steps are necessary.
The different steps are color coded. The legend at the top of the chart shows the color coding. More information on what each step means can be found in the knowledge base article Waterfall timings.
A waterfall chart in a transaction monitor displays Core Web Vitals and W3C navigation timing metrics for each navigate in a transaction step. The metrics are displayed above the waterfall chart. When a step contains multiple navigations, the chart shows the metrics for all navigations by displaying a vertical dark green line. When hovering over the line the exact metric is displayed.
Below the waterfall chart a summary of all timings per request type is shown.
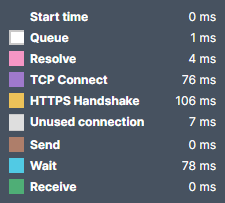
Timing specifics
To get more detailed or background information on the page element measurements, you can hover over the measurements for an element and a popup with the details for this specific element appears.
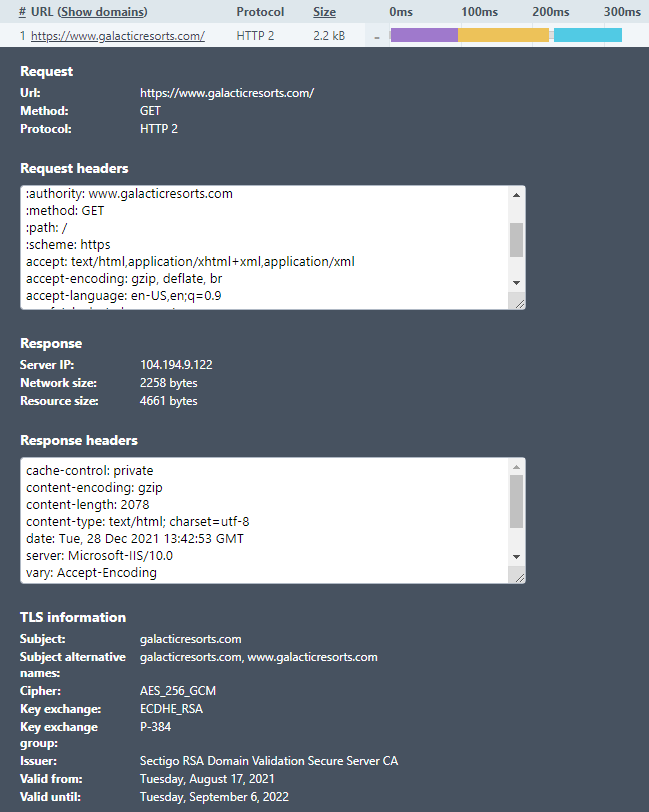
The request/response panel
For each individual element in the waterfall, you can click the + symbol to open up the request/response panel. This panel will contain information about the request that was made to retrieve the element, and the following response.
It contains the following information:
- The request URL, method, and protocol used
- An overview of the request headers included in the request
- The IP address of the responding server
- Information about the (un)compressed size of the element:
- Network size: the actual number of bytes that were downloaded (compressed size)
- Resource size / uncompressed size: Size of the element after decompression, if applicable
- Any response headers that were included in the response
If you’re using a Full Page Check with extra metrics, the request/response panels will also include the relevant TLS information for that element. Additionally, these waterfalls can display further element details, such as the request being cached, preloaded or aborted, and they support data URIs (when the page HTML contains inline image data). This extra information is available in the request/response panels for individual elements, where applicable.
Other options to refine the information
The columns with the page element number (#), the element name (URL) and the element size (Size) can be clicked to sort the complete waterfall chart based on the values in those columns.
If you have many elements in the page, it may be necessary to filter the chart by (part of the) page element’s name. Use the Filter field to fill in your term to filter by.
Export of the waterfall chart
The waterfall chart can be exported to a PDF file. These PDFs can be used as backup of your waterfall measurements. Sometimes a PDF export can be handy to show waterfall charts to third parties without sharing dashboards.
Click the Export to PDF button on the right above the chart to start generating a PDF copy of your waterfall chart and saving it.