
In this exercise, you’ll go through the editing and testing process for a simple transaction, and do some basic troubleshooting.
The example used here comes from an earlier exercise: Capturing the shopping cart user journey. If you haven’t already completed that exercise, you may want to do so now, or you can cut and paste the script into the step editor.
Manual testing in development mode
You have three options for your monitors: development, staging, and production mode. Testing in development mode is the most important thing you can do before moving a transaction script to staging or production mode. Learn more about monitor modes.
- In the Uptrends app go to .
- Open the transaction monitor that was uploaded by the transaction recorder.
- Make sure that you are on the Main tab.
- In the Status section set the Mode to “Development”.
- Click the button.
Start your testing using “Test now”
Whether you’re starting with a script straight from the transaction recorder, making changes to your script, or troubleshooting problems on a script in production, you’ll use the Test now button. To check for problems, you can run a quick test this way.
- Open the transaction monitor created for this tutorial.
- Press the Test now button at the bottom of the page. The Test from: pop-up window appears.
- Choose a checkpoint from which to run your test.
- Click .
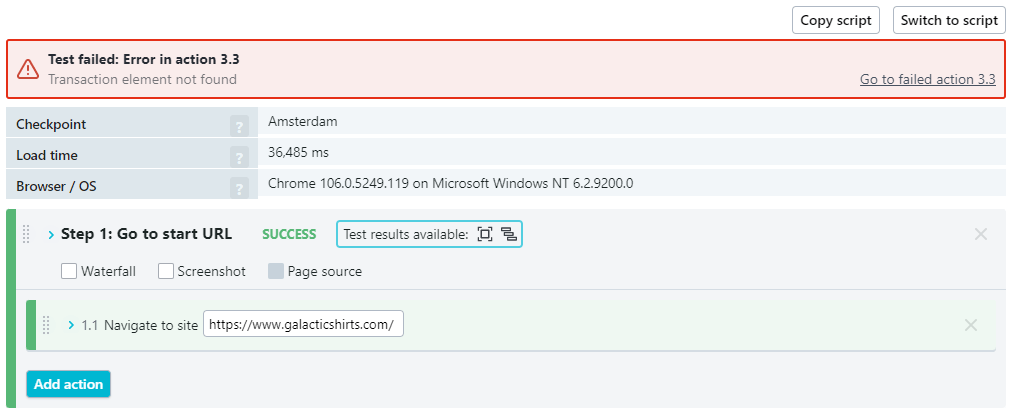
After you begin the test, the editor automatically scrolls to the top of the page, and the checkpoint adds your monitor to the test queue. Once the test starts, you can watch the test as the checkpoint steps through your script. If your script finishes with a successful test, that is good, but there is more to be tested.
If you’re using the sample script, you’ll notice that Step 1 (Navigate) and Step 2 (Click on an element) were executed successfully, but Step 3 failed on action 3.3.
Troubleshooting the script
A transaction may fail for many reasons while in development mode such as missing content or the wrong selector choice for elements, tabs, and frames. Timing issues and missing interactions also could play a role. Check out the following tips for the most common problems.
Problem: Element not found because of dynamic IDs
In the example script test, you can see in the test results that the monitor couldn’t find the element specified in the CSS selector. The action tells the checkpoint to change the quantity, but since the monitor can’t find the element, the action fails. The knowledge base article selector alternatives contains more information on selectors.
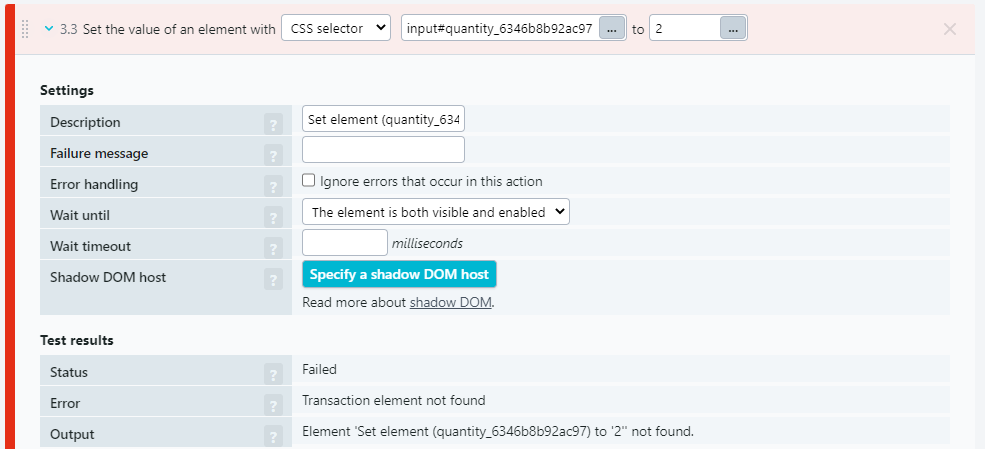
The full CSS selector reads:
#quantity_6346b8b92ac97
So, the monitor watches and waits for an element on the page with id=“quantity_6346b8b92ac97”, and when it appears, the monitor sets the element’s value to “2.” However, the element with id “quantity_6346b8b92ac97” never appeared. Why? The selector is looking for a specific ID, but the server dynamically generates the element’s ID. Each time the page loads, the server gives the element a different ID. To fix this, there are other ways to identify an element other than its ID.
Solution: Use a different selector
To get around the problem caused by dynamic IDs, you need a different selector. Click on the ellipsis button in the selector indicator box to view a list of other possible selectors.

A pop-up with selector alternatives opens:
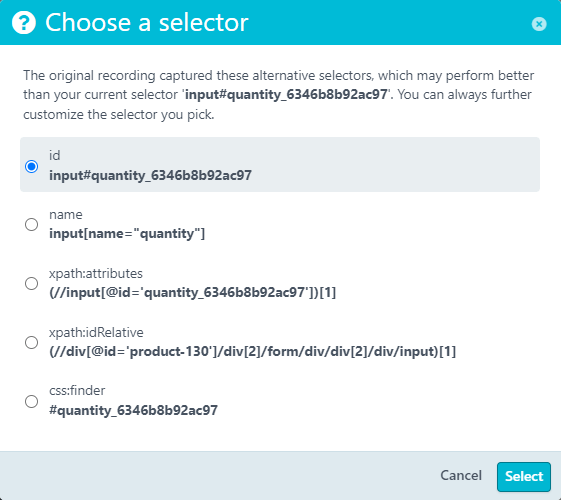
In this case, you’ll notice that several of the selectors use the dynamically created value, so you can eliminate those selectors right away. Two other options don’t include the dynamic ID: name and xpath:idRelative. The recorder automatically orders the selectors based on its opinion of what selectors will work best. In this case, the second recommendation, “name” may work better for identifying the element. The name value is an element attribute, and if unique to the page, the selector is probably your best choice.
As it turns out, the xpath:idRelative option also works in this case. Uptrends gave you two valid choices that work great in development mode, but you won’t know for sure that they work well until you move the script to staging mode. However, you’ve got more things to do before moving your script to staging or production mode.
Problem: Element not found due to lack of user interaction
Just like dynamic IDs, dynamic content that requires user interaction before an element is visible can also cause problems. Finding them may be tricky, but the place to start is to really consider the details of the user interactions.
Solution: Add hover actions
Some page elements do not load or become visible until the user hovers the cursor over the element. For example, if a user needs to hover over a menu to make the submenus visible and accessible, the script needs to perform the hover action too. However, the transaction recorder can’t capture hover events, and if an element is not visible on the page, the script can’t interact with it. You’ll need to add a hover action before the dependent interaction. Learn more about hover actions and how to configure them.
Problem: Error due to time out
When the script is running, it continues to look and waits for elements to load. The default wait time is 30 seconds, and 30 seconds is typically plenty of time. However, if the 30 seconds is not enough time, you may have reason to add additional wait times to an action. For more information on using wait conditions, see our knowledge base article Using wait conditions.
Solution: Causes and (possible) solutions for timing issues
If you have identified a timing issue, there can be different causes and solutions to it.
- Element is not yet interactable - extend the wait time.
- Transaction timeout - A transaction has a maximum run time. Ask support to look at your script to help you find the issue.
Problem: Errors in set actions
Missing clicks before set actions may cause unexpected errors. Avoid errors by always including a click action with each set interaction.
Solution: Add click actions
Don’t use the Enter key - When recording your transaction, you may have used the Enter key rather than clicking a submit button. For example, when using a search feature, the natural action is to hit Enter rather than the search button. The recorder can’t pick up the use of the Enter key. When you find you’ve done that during your recording, add the click action. If there is no button option, contact support to help you figure out a solution.
Missed clicks - Don’t remove the clicks that appear before entering values into fields. Click events trigger value masks and other events within the browser. In some cases adding two clicks before entering a value is necessary.
Learn more about click actions.
Script testing checklist
Before moving your transaction monitor to staging, there are several things you must check first.
- Put in content checks. Add a content check after every page transition to verify that the right page loaded with the correct content.
- Check the screenshots and waterfalls. While in development mode, each step generates a screenshot of the browser window and waterfall chart, check the waterfalls and screenshots to verify page flow, content, and accuracy of products/items.
- Read the transaction caveats. Make sure your monitoring will not have negative consequences for your business.
- Add click actions before entering values in text boxes.
Switch to staging mode
Once you have refined and tested your code in development mode, the next step is to move into staging mode. Learn more about monitor modes).
- In the Uptrends app go to .
- Open the transaction monitor that was created for this tutorial.
- Make sure that you are on the Main tab.
- Change the Mode to “Staging”.
- Set the monitor to Enabled by checking the box.
- Click .
You will want to run your new transaction monitor in staging mode for a couple of weeks to test its stability, especially after site updates. Moving the tests to the more extensive checkpoint network may expose localization problems as well.
Although the tests in staging mode do not generate alerts, you can view the monitor logs and the Transaction dashboard to see any errors your monitor may have encountered. In the Monitor log (and other dashboards), notice the Erlenmeyer flask icon next to your monitor in staging mode.
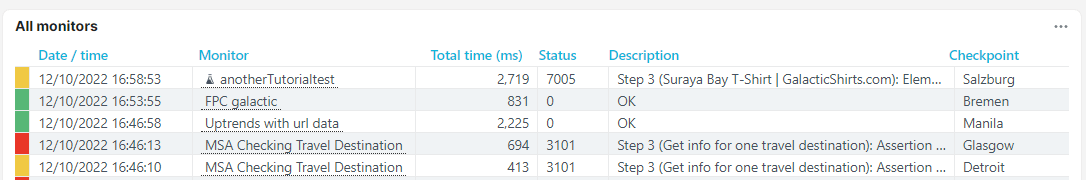
Clicking the time stamp of the error opens the Check details report which gives you information about the transaction up to and including the error.