
Loading a page in a browser takes place over several steps. As more and more of the page elements are loaded, the browser will begin to display the page content and shift its layout, until the loading is finished and your monitor (hopefully) returns an Ok result. A waterfall chart is a good representation of what happens while the page is loading, but with many elements loading simultaneously, it may be difficult to form an image of what actually happens in the browser.
Browser and transaction monitor types includes Timeline screenshots, also known as a filmstrip. This feature captures a sequence of screenshots from the browser, showing exactly what the page looked like at different points during its loading process.
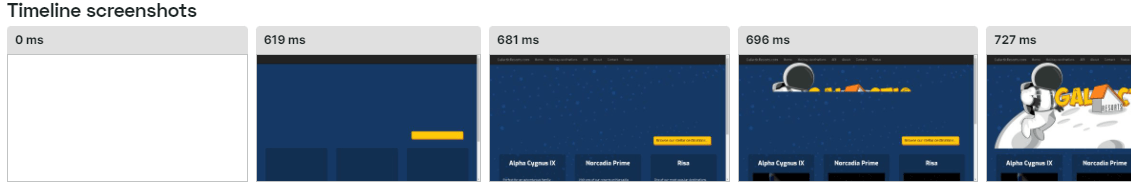
If your waterfall contains any points of worry, such as images failing to load or scripts holding up the rest of the page, you can cross-reference the waterfall timeline with the relevant screenshot to see what the page looked like at that point.
When are timeline screenshots taken
The timeline screenshots as shown in Uptrends are sourced directly from Chrome. As part of its default features, Chrome collects its own screenshots when a performance recording is made in its Dev tools interface. From this set captured by Chrome, we’ll attempt to display the most relevant ones:
- We’ll grab the first screenshots after certain milestones (first/last screenshot, first contentful paint, largest contentful paint, time to interactive).
- Based on the total time duration of the monitor, we’ll decide how many screenshots should be presented, but with a minimum of six.