
Uptrends offers a wide range of synthetic monitor types, including Uptime, Browser, Transaction, and API monitors. Each monitor type has different configuration options that allow you to define what to monitor, how often checks run, what counts as an error, and how alerts are triggered.
Configuring these settings ensures that your monitoring captures the information you need based on your requirements and provides accurate insights. You can access and adjust these settings by opening the Monitor Editor. For instructions on how to open the Monitor Editor, see Create a monitor.
Access the Monitor Editor
Access the editor using any available option, depending on your interface:
- Go to Monitoring > Monitor setup. Click a monitor you like to edit.
- In Synthetics, hover over a monitor type and click the setup page. Click a monitor you like to edit.
- Go to Configure > Monitors +.
Monitor Editor
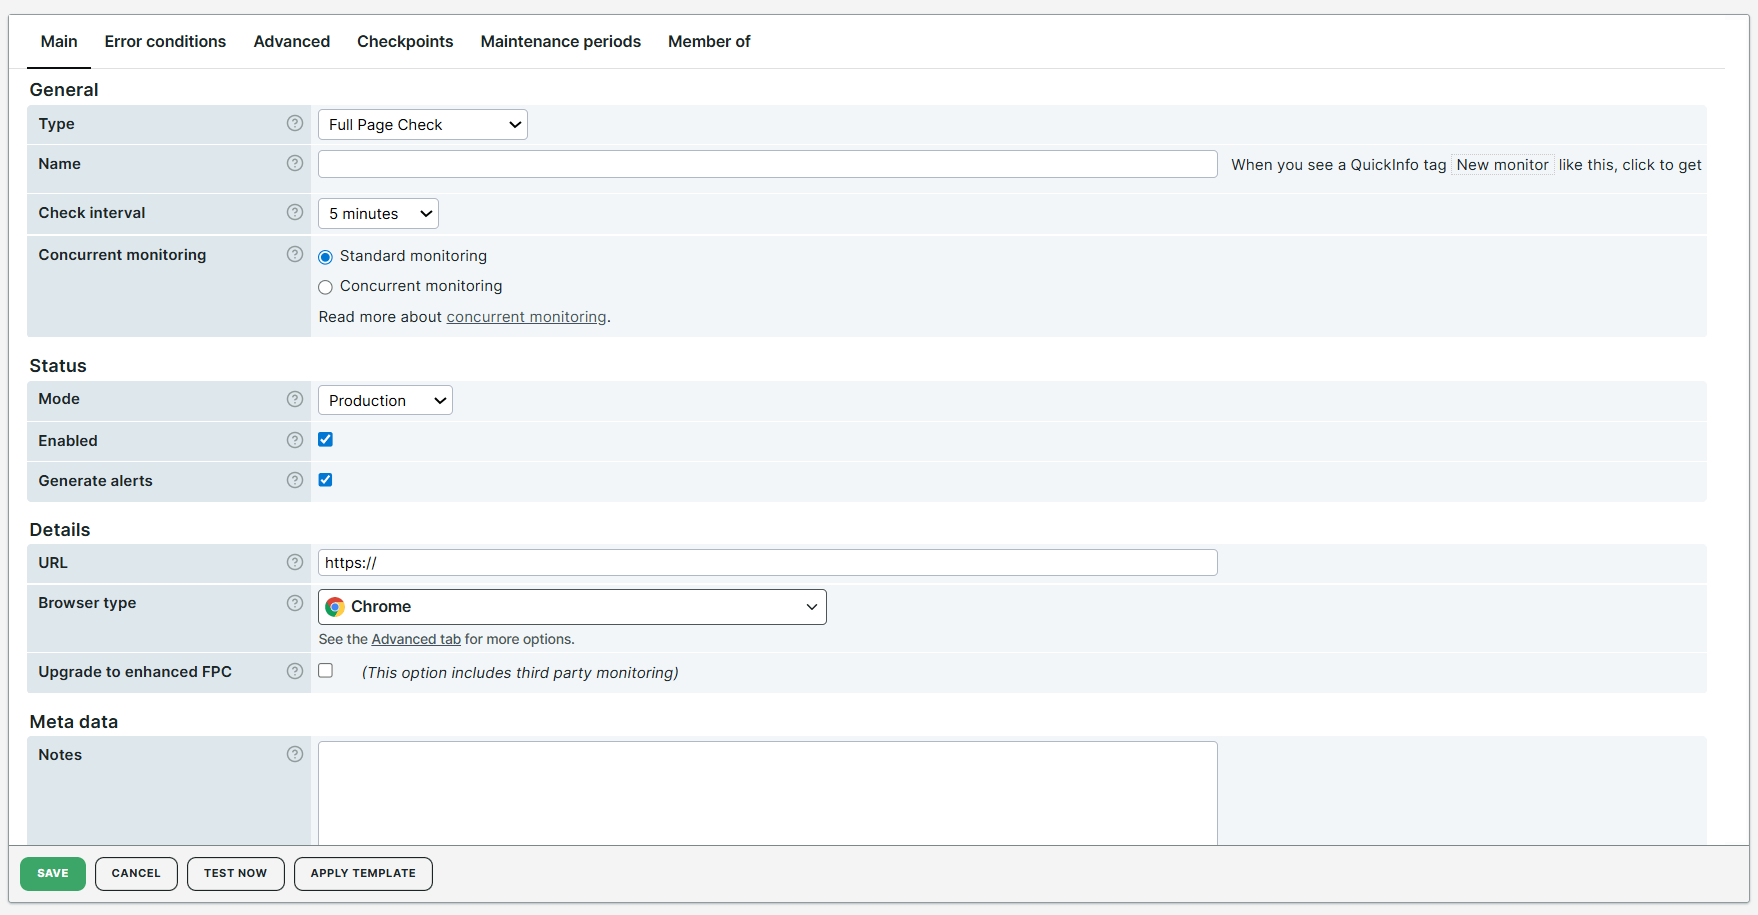
Use the Monitor Editor to configure a monitor end to end. Related options are grouped into sections so you can work through settings in a clear order.
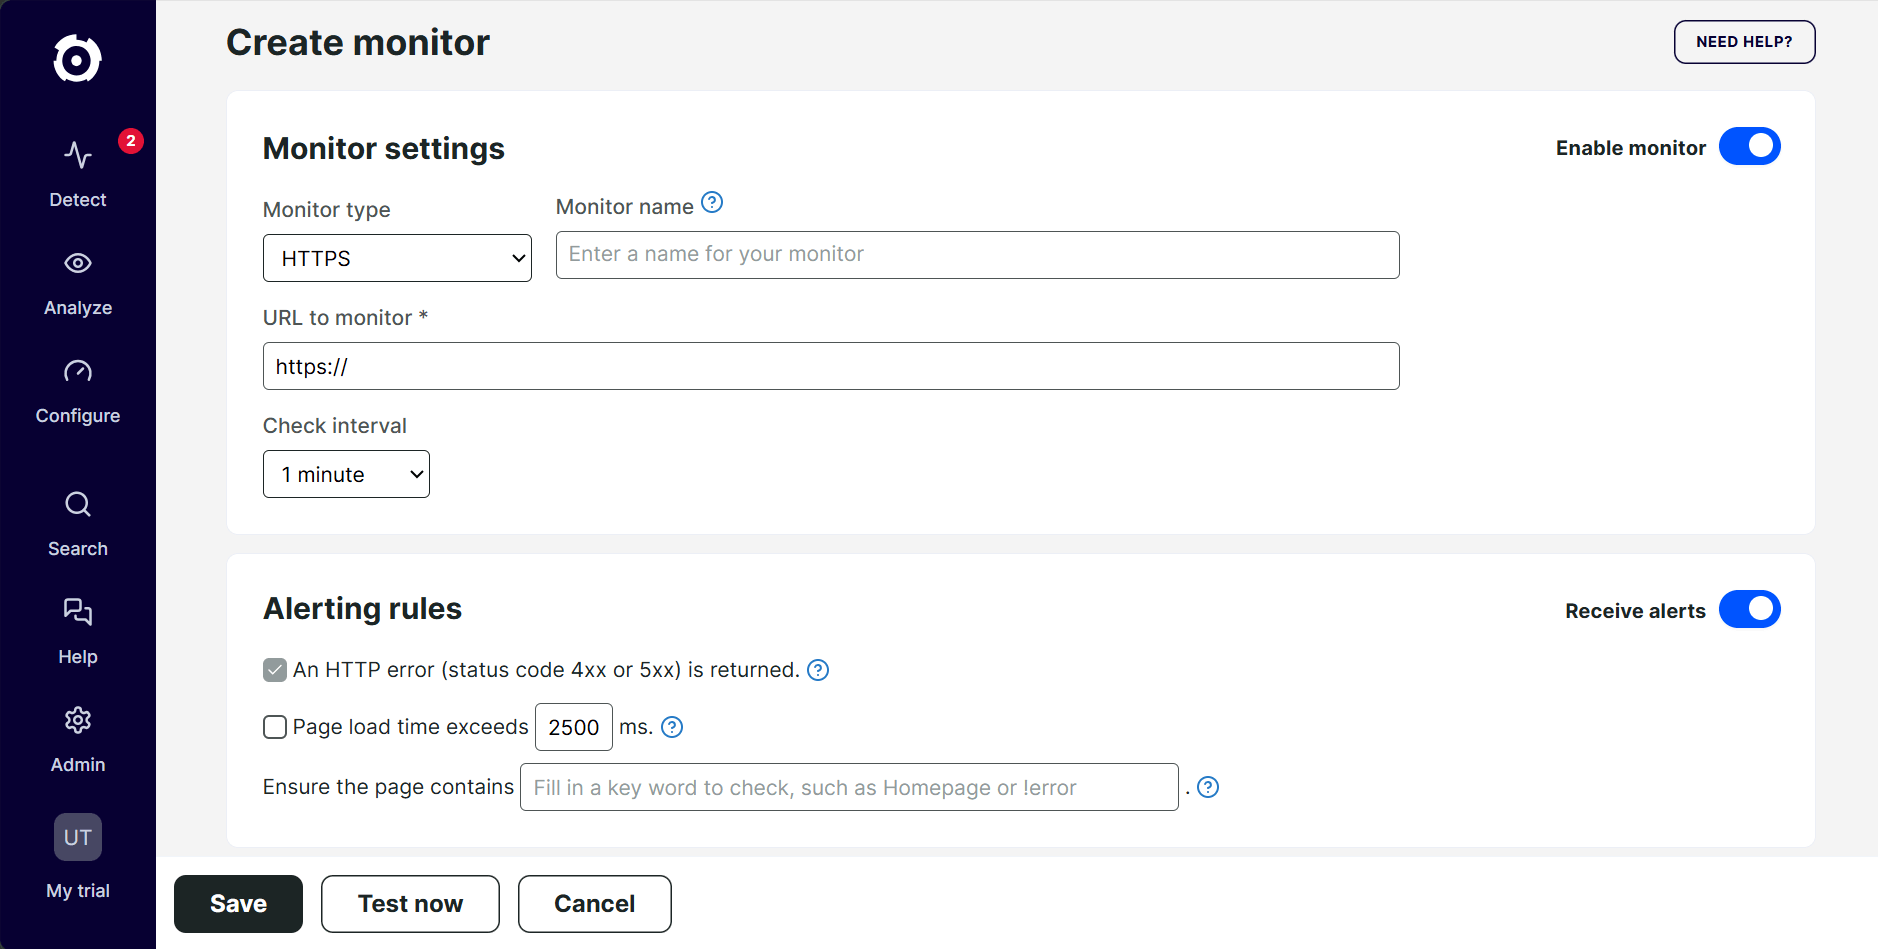
Uptrends provides a simplified view of the Monitor Editor available in the modern web application interface only. It shows a straightforward flow for configuring essential monitor settings. Clicking the Go to advanced settings button at the bottom of the page shows you more options.
The following sections describe the settings you can configure in each tab of the Monitor Editor. API and Transaction monitors have additional monitor-specific settings that are not covered here. For API monitor-specific settings, see Multi-step API monitoring overview. For Transaction monitor-specific settings, see Understanding steps in a transaction monitor.
Main tab
The Main tab contains the general monitor settings, where you can set the name, status, and other details of your monitor. In this tab, you can customize the following settings by category:
General
- Set a monitor type.
- Set a monitor name. When you create or rename a monitor, Uptrends warns if that name is already used in the account. You can change the name or save anyway. The check is a warning, not a block.
- Set the check interval to specify how often your monitor is checked.
- Select between standard or concurrent monitoring to specify if the monitor should be executed on multiple checkpoint locations at the same time or not.
Status
- Set the monitor mode to specify if your monitor should run in development, staging, or production mode.
- Enable (activate) or disable (deactivate) monitor status.
- Enable (activate) or disable (deactivate) generating monitor alerts.
Details
- Set the IP address that will be used to connect to the checkpoint server.
- Set the URL or IP address of the website, webservice, or server that you want to monitor.
- Use dynamic values in URL and post content.
- Set the browser type that will be used to load the website.
- Set domain groups to manage and organize multiple domains.
- Set the port number for specific monitor types.
Meta data
- Add monitor notes to describe the purpose and usage of the monitor.
- Use custom fields to include external information and custom data from third-party integrations as part of your alerting.
Steps tab
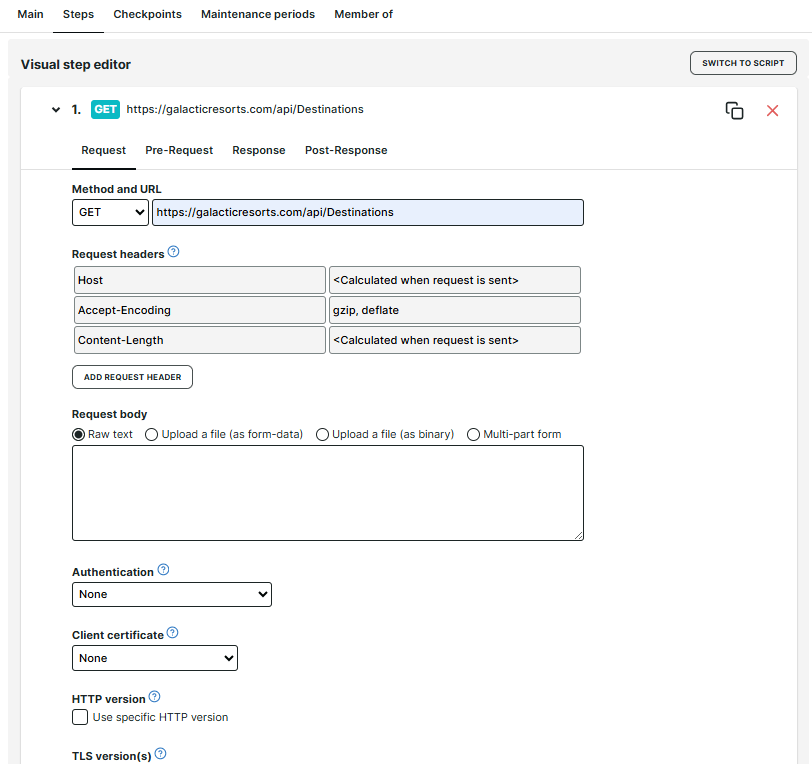
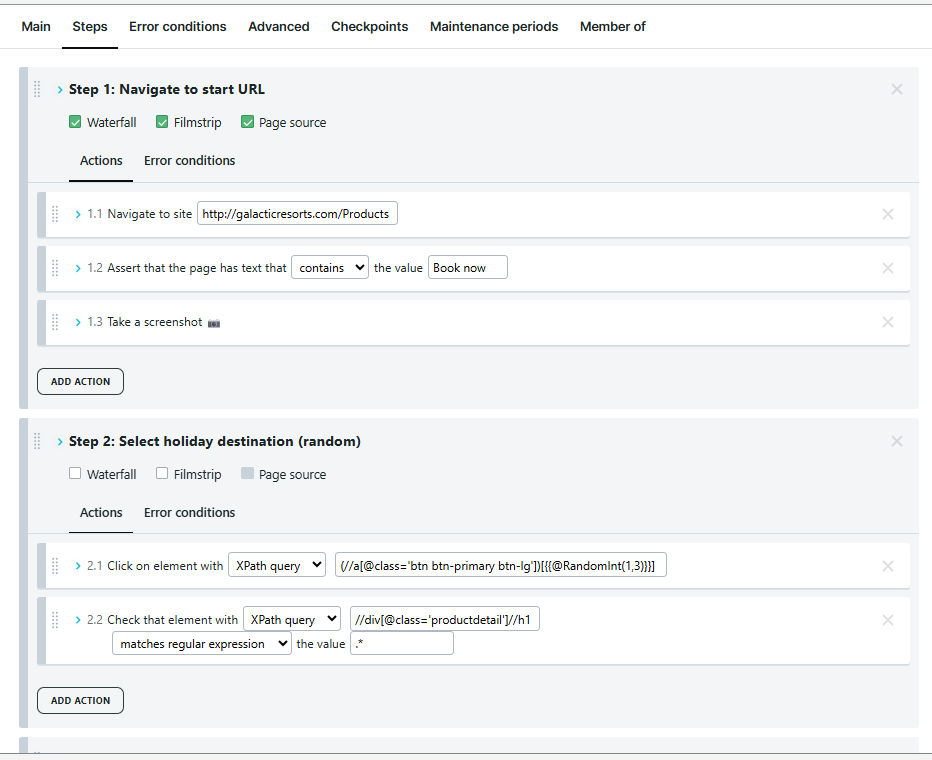
The Steps tab contains the settings to create and manage API scenarios or the user navigation flow for selected monitors.
In a multi-step API monitor, this tab allows you to set up API calls, manage HTTP requests, and validate HTTP responses. You can simulate real API workflows to monitor the performance and availability of your endpoints. For more information, see the Multi-step API monitoring overview article.
In a transaction monitor, this tab allows you to simulate a user journey to test the transaction flow of your website from end to end. You can replicate real-world scenarios, such as filling out a form, adding items to cart, or purchasing an order to validate that users can interact with your website and that it functions as expected. For more information, refer to Understanding steps in a transaction monitor.
Error conditions tab
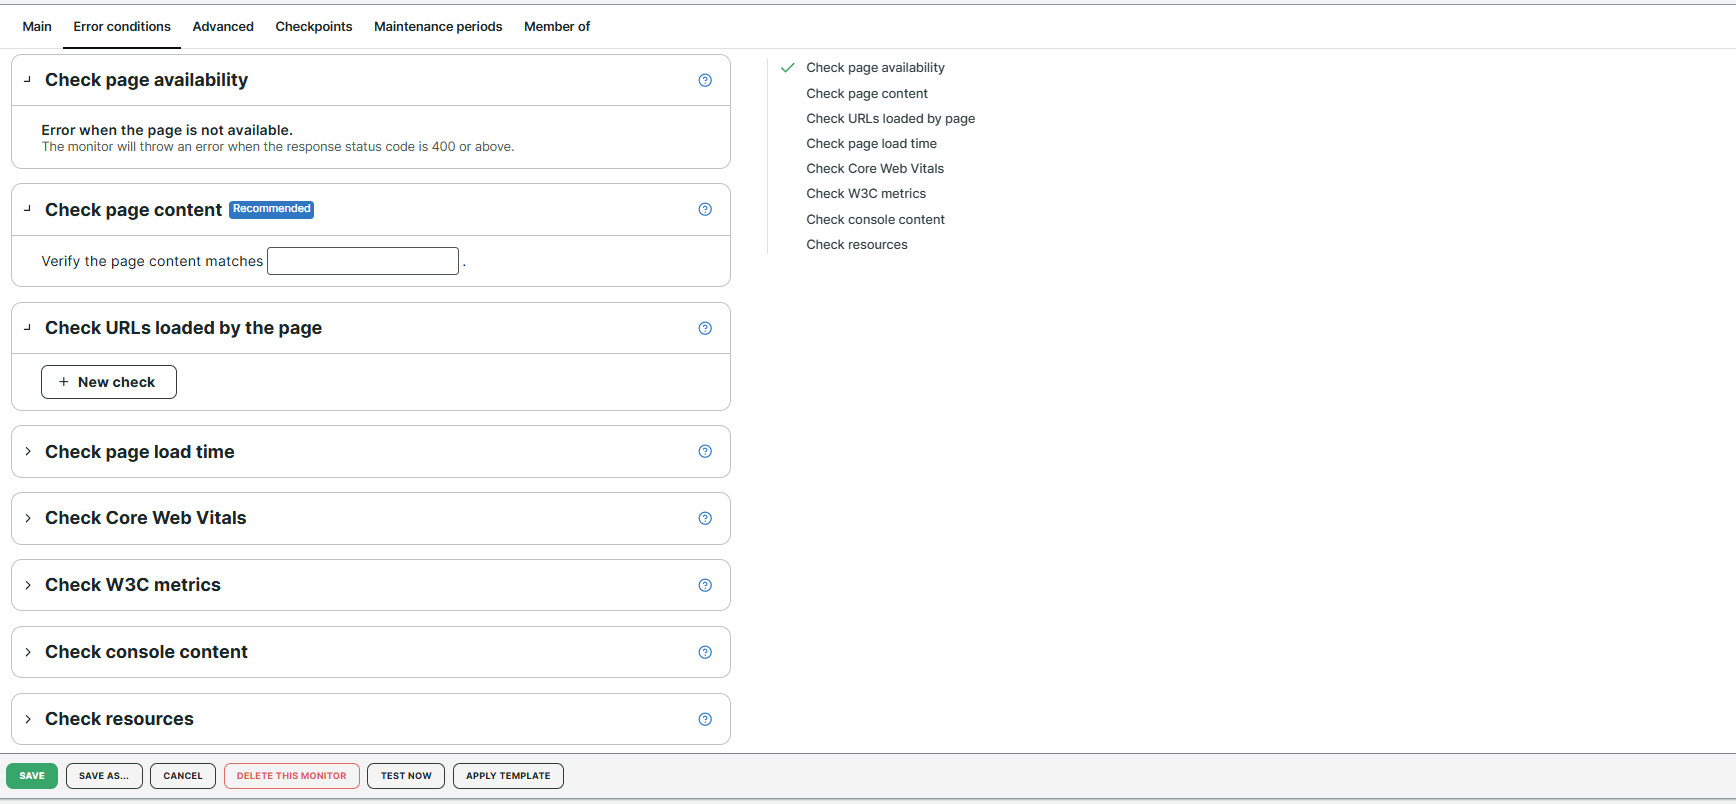
The Error conditions tab contains all the conditions that you can set to inform your monitor of any errors on your website, web service, or server. These conditions are your monitor’s basis for deciding which website behaviors result in an error and which don’t. For more information, see the Error conditions overview knowledge base article.
Advanced tab
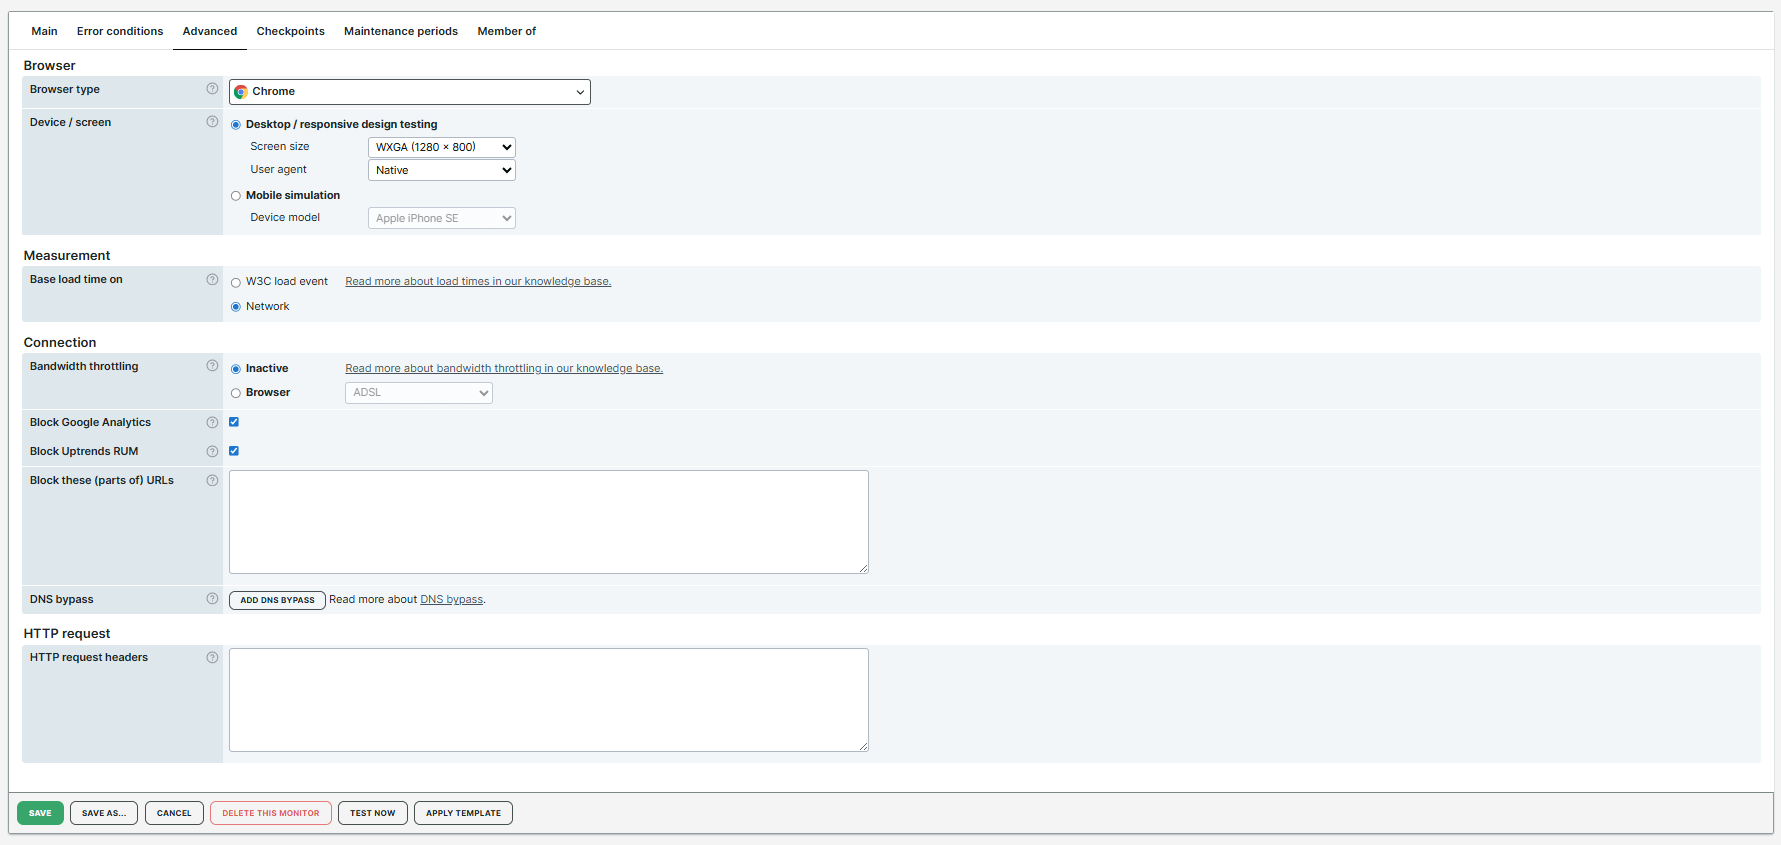
The Advanced tab contains the following categories to further customize browser types, HTTP requests, and authentication settings for your monitor:
Advanced
- Set the user agent to identify the browser type and operating system of the user. For more information, see the User agent article.
Browser
- Set the browser type that will be used to load the website.
- Specify whether the browser used to test your website’s behavior will run on a desktop or mobile device. Provide the appropriate settings, such as screen size, user agent, or device model, whichever applies.
Measurement
- Set the load time based on the W3C total time metric or your own network activity.
Connection
- Use bandwidth throttling to intentionally limit the amount of data that can be transferred over a network connection in a given amount of time.
- Block or disable outgoing requests to Google Analytics.
- Block or disable Uptrends RUM to avoid additional RUM pageviews.
- Block specific URLs to prevent the monitor from making requests to those addresses.
- Set a DNS bypass to resolve certain URLs to a custom IP address.
Authentication
- Use Basic, NTLM (Windows), or Digest authentication if the website you are monitoring requires authentication as part of the HTTP request. Enter your credentials in the username and password fields. Note that Uptrends always encrypts your data for protection.
HTTP request
- Set the HTTP methods (GET/POST), request headers, and request body for a more specific monitoring configuration.
- Enable or disable checking for SSL certificate errors.
- Set specific TLS versions that should be supported when running a monitor check.
- Set specific HTTP versions that should be supported when running a monitor check.
For details on how to monitor non-production websites with HTTP requests, see How to monitor websites other than the production server.
Checkpoints tab
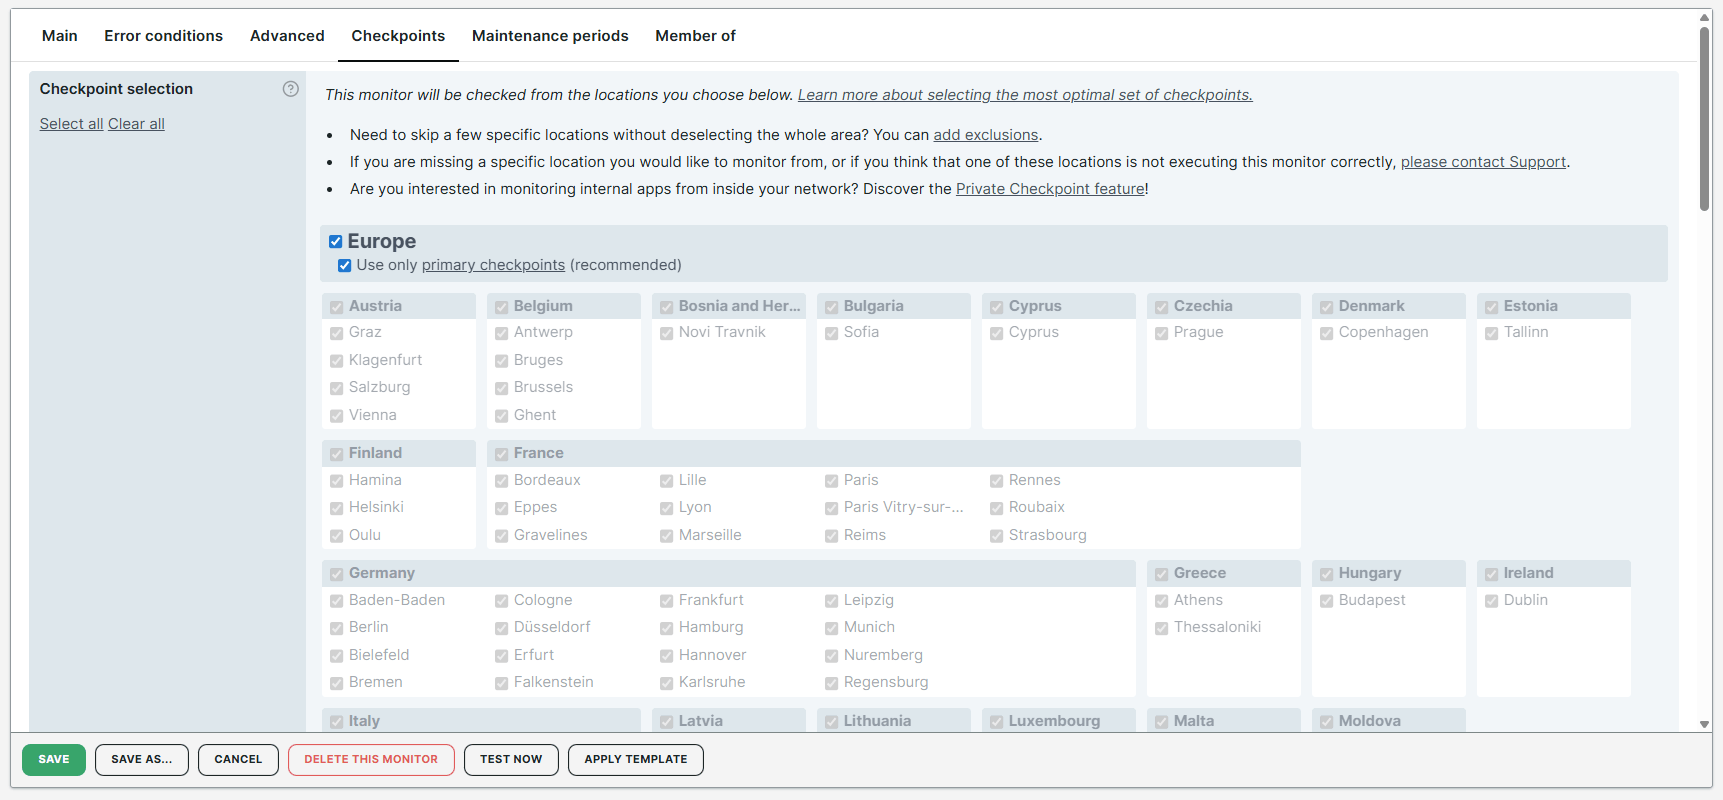
The Checkpoints tab allows you to specify checkpoint locations for monitoring your server, website, or web service. For more information, see the Checkpoints knowledge base article.
Maintenance periods tab
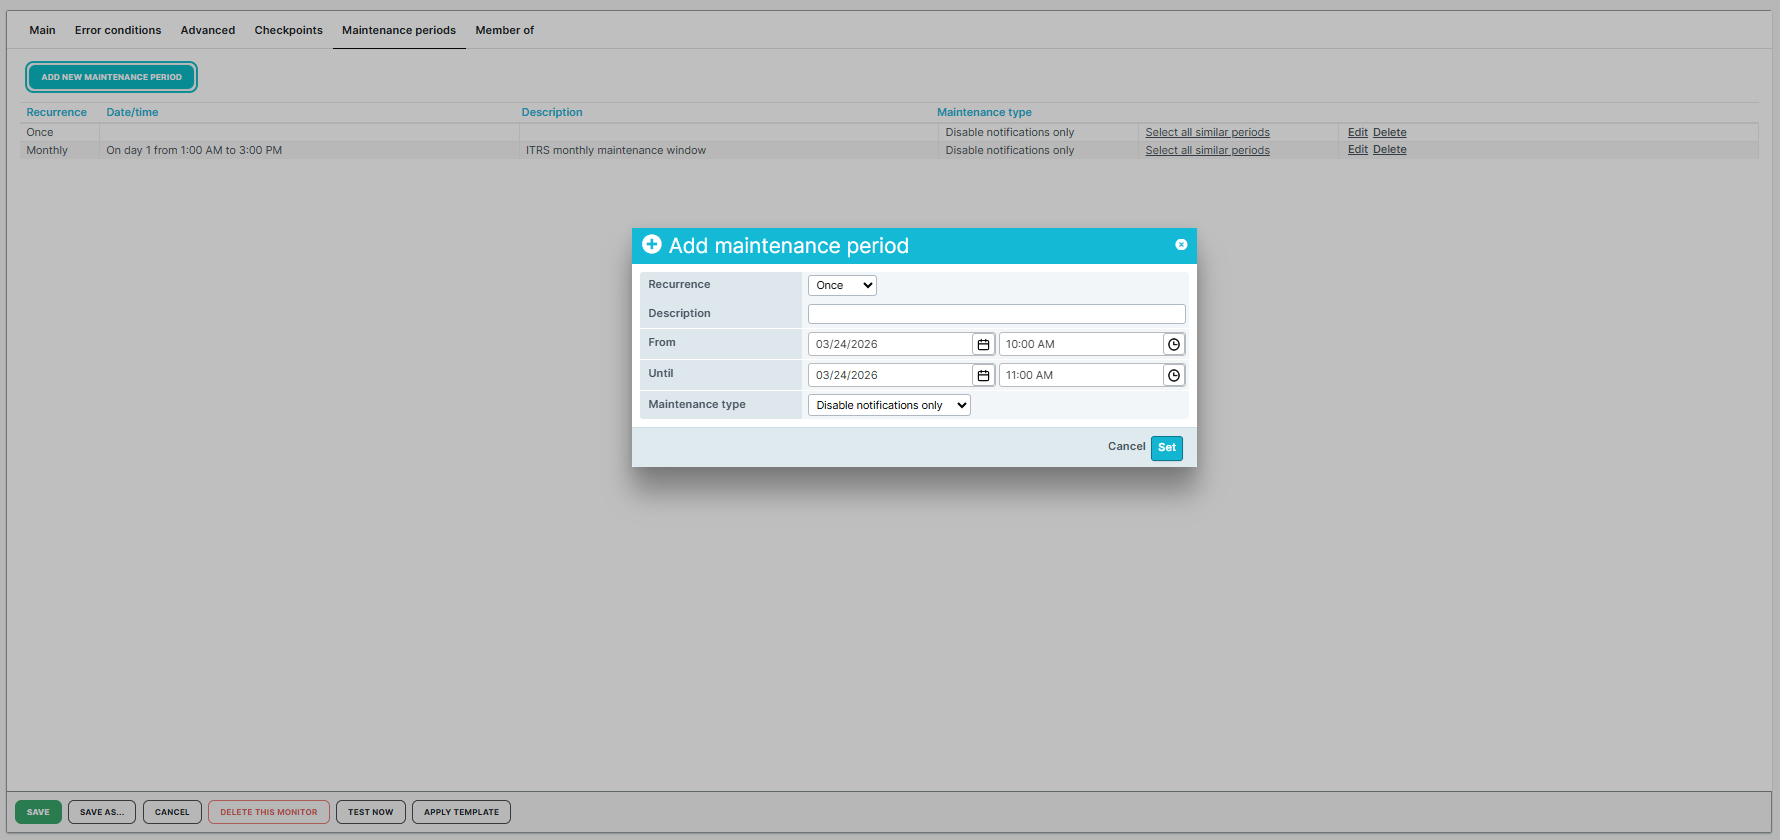
The Maintenance periods tab allows you to schedule maintenance periods whenever your servers, websites, or web services are down for planned maintenance. For more information, see the Maintenance periods knowledge base article.
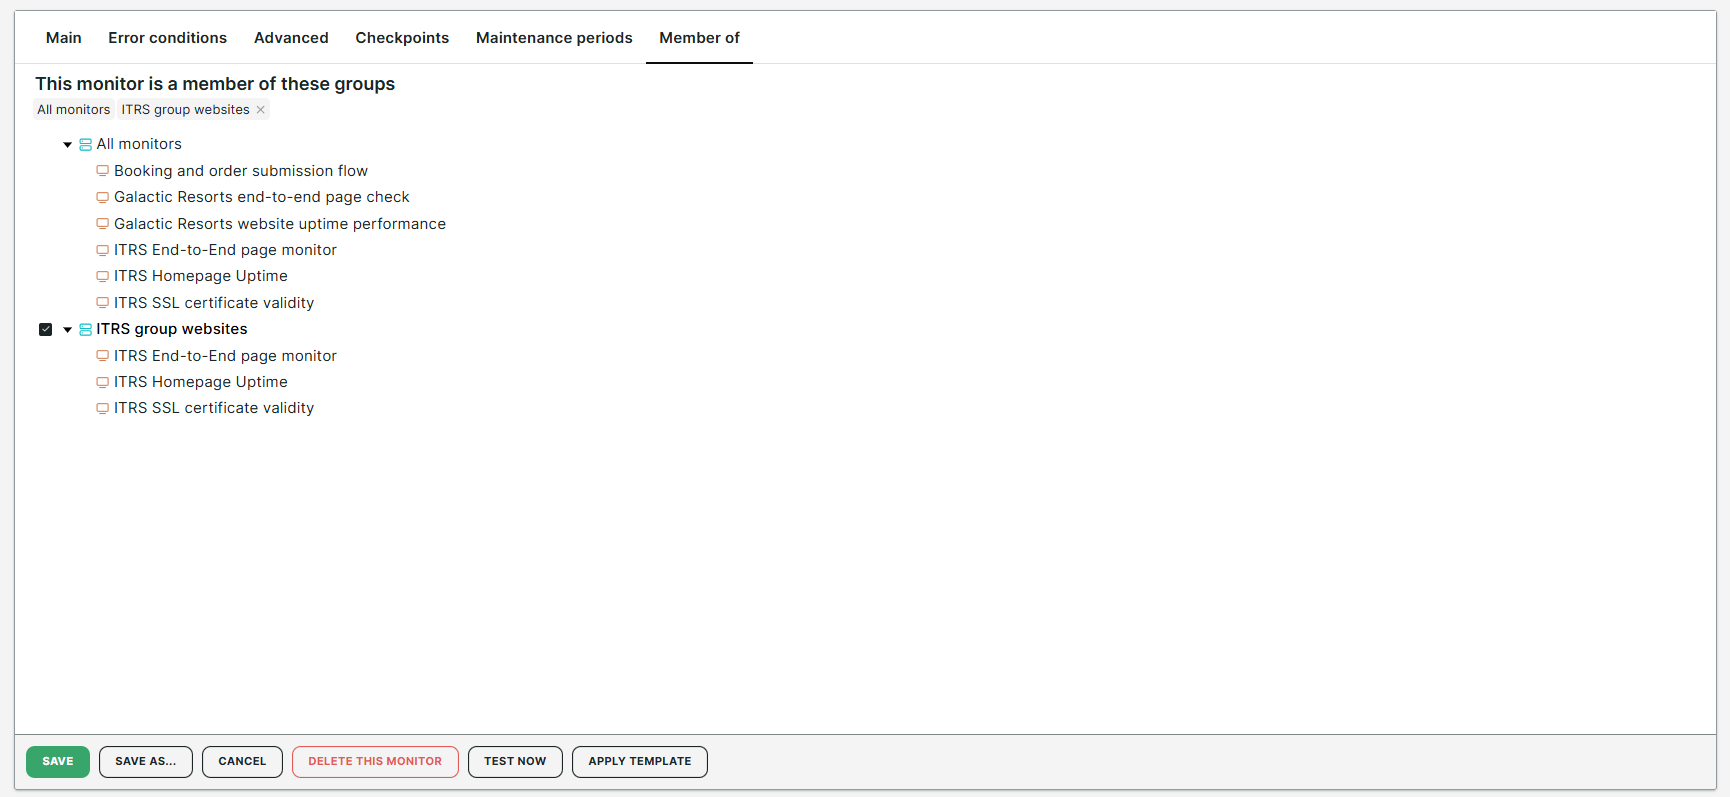
Member of tab
The Member of tab allows you to include your monitor as a member of a monitor group. For more information, see the Monitor groups knowledge base article.
Permissions tab
The Permissions tab allows you to set permission rights to an individual operator or operator group. For more information, see the Permissions knowledge base article.
