
Consolidate observability without losing visibility
Running multiple tools and dashboards across teams wastes budget and hides gaps in coverage. Add a dedicated DEM layer into your observability platform so you can reduce tools while keeping independent validation of how end users experience your web services.
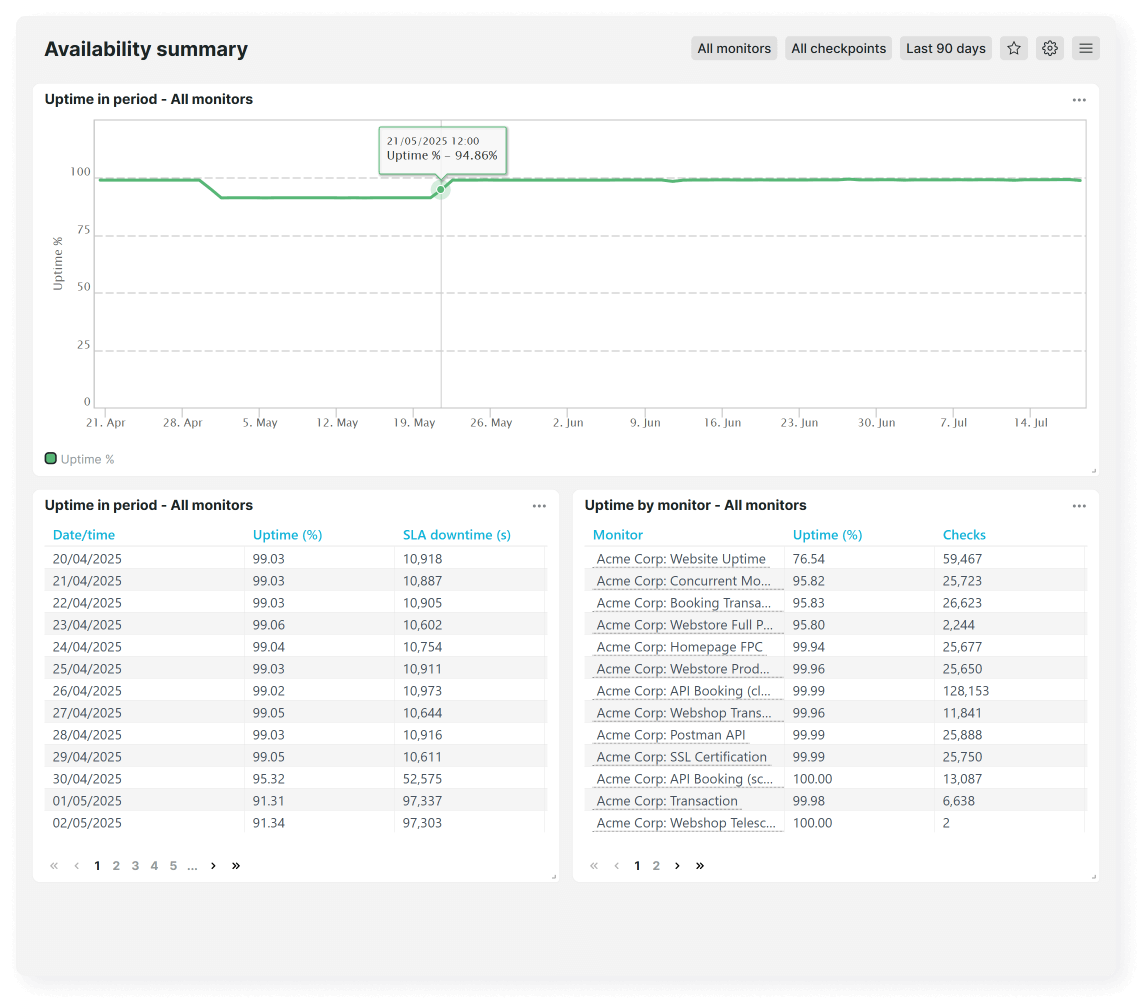
Prove SLOs
against the real digital experience
Hitting internal SLOs doesn’t help if end users are still seeing failures. Use synthetic journeys and API checks from real consumer ISPs and validate reliability targets against what users actually experience, not just what your services report.
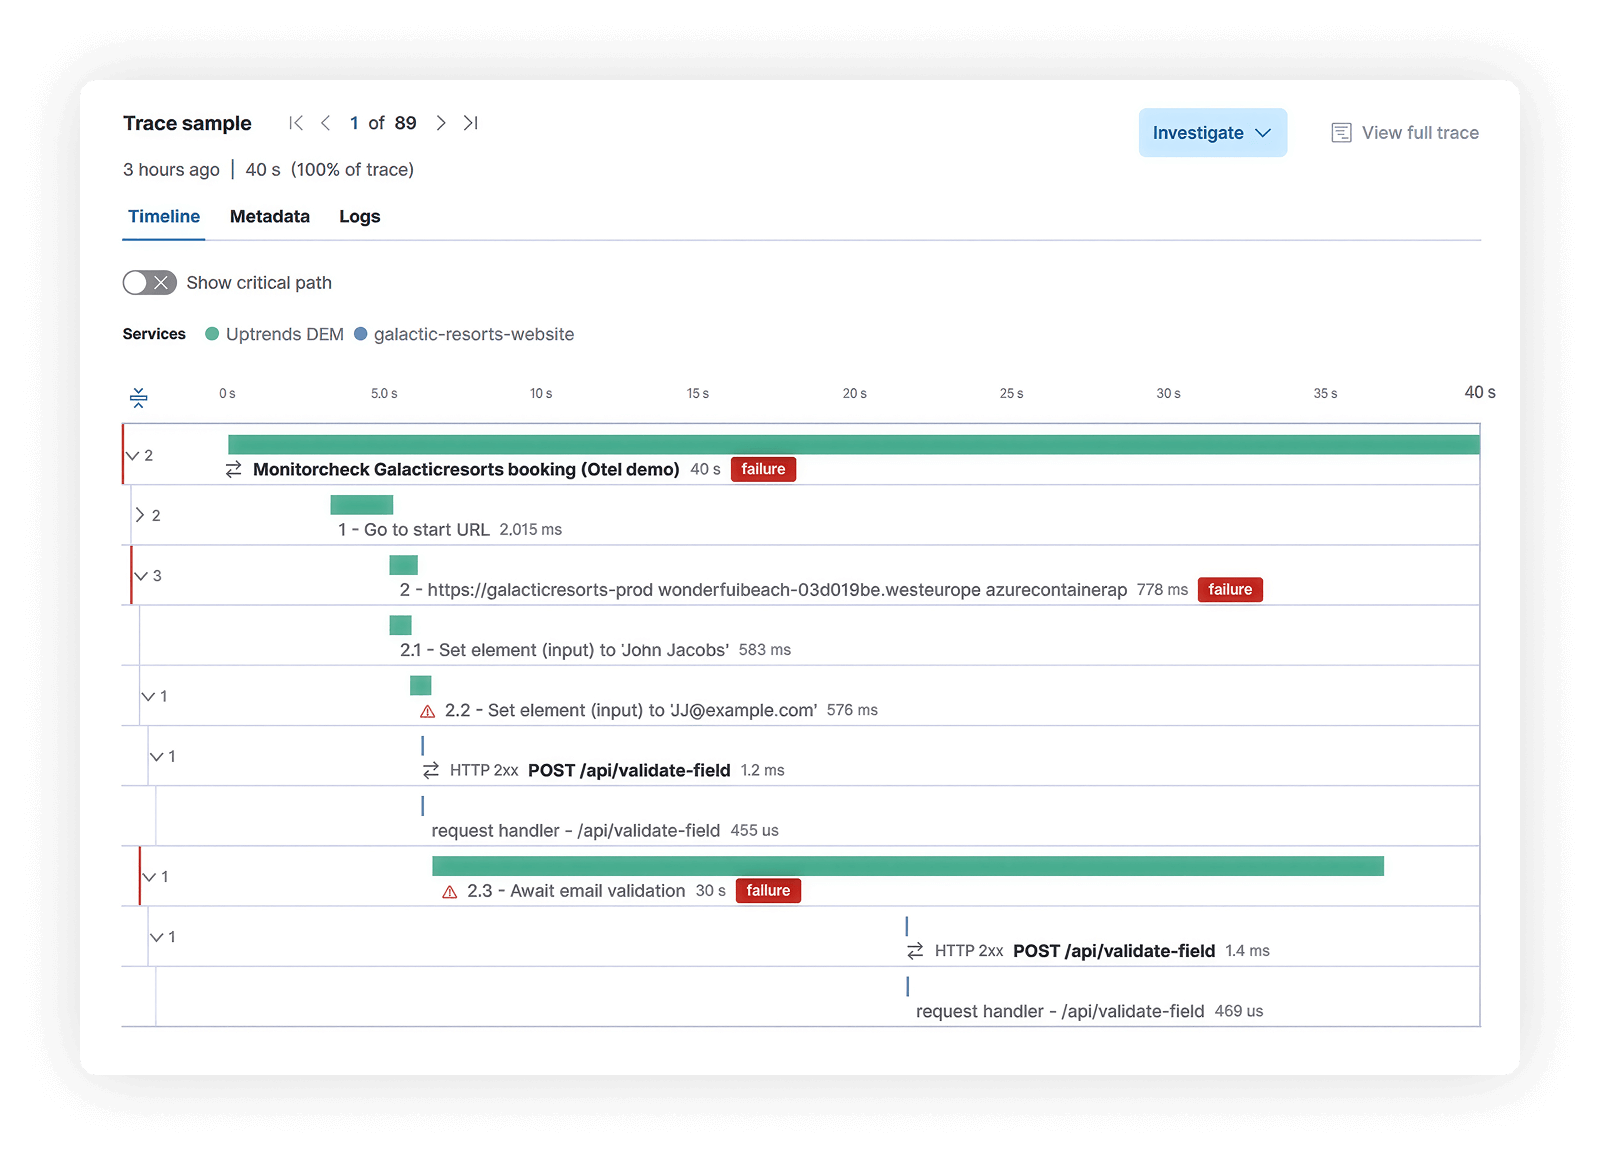
Cut MTTR
with trusted
external signals
Incidents drag on when teams can’t agree where the problem sits. Start every incident with a clear outside-in signal that shows who is impacted and from where, then line it up with your logs, metrics, and traces to accelerate resolution.
“Uptrends lets us run checks where our travelers are, helping us account for regional differences in availability and performance.”

Offer observability-as-a-service, not ticket queues
Central observability teams shouldn’t be stuck hand-configuring monitors for every product. Let teams self-serve digital experience checks within guardrails, using shared templates and role-based access so you stay in control without becoming a bottleneck.
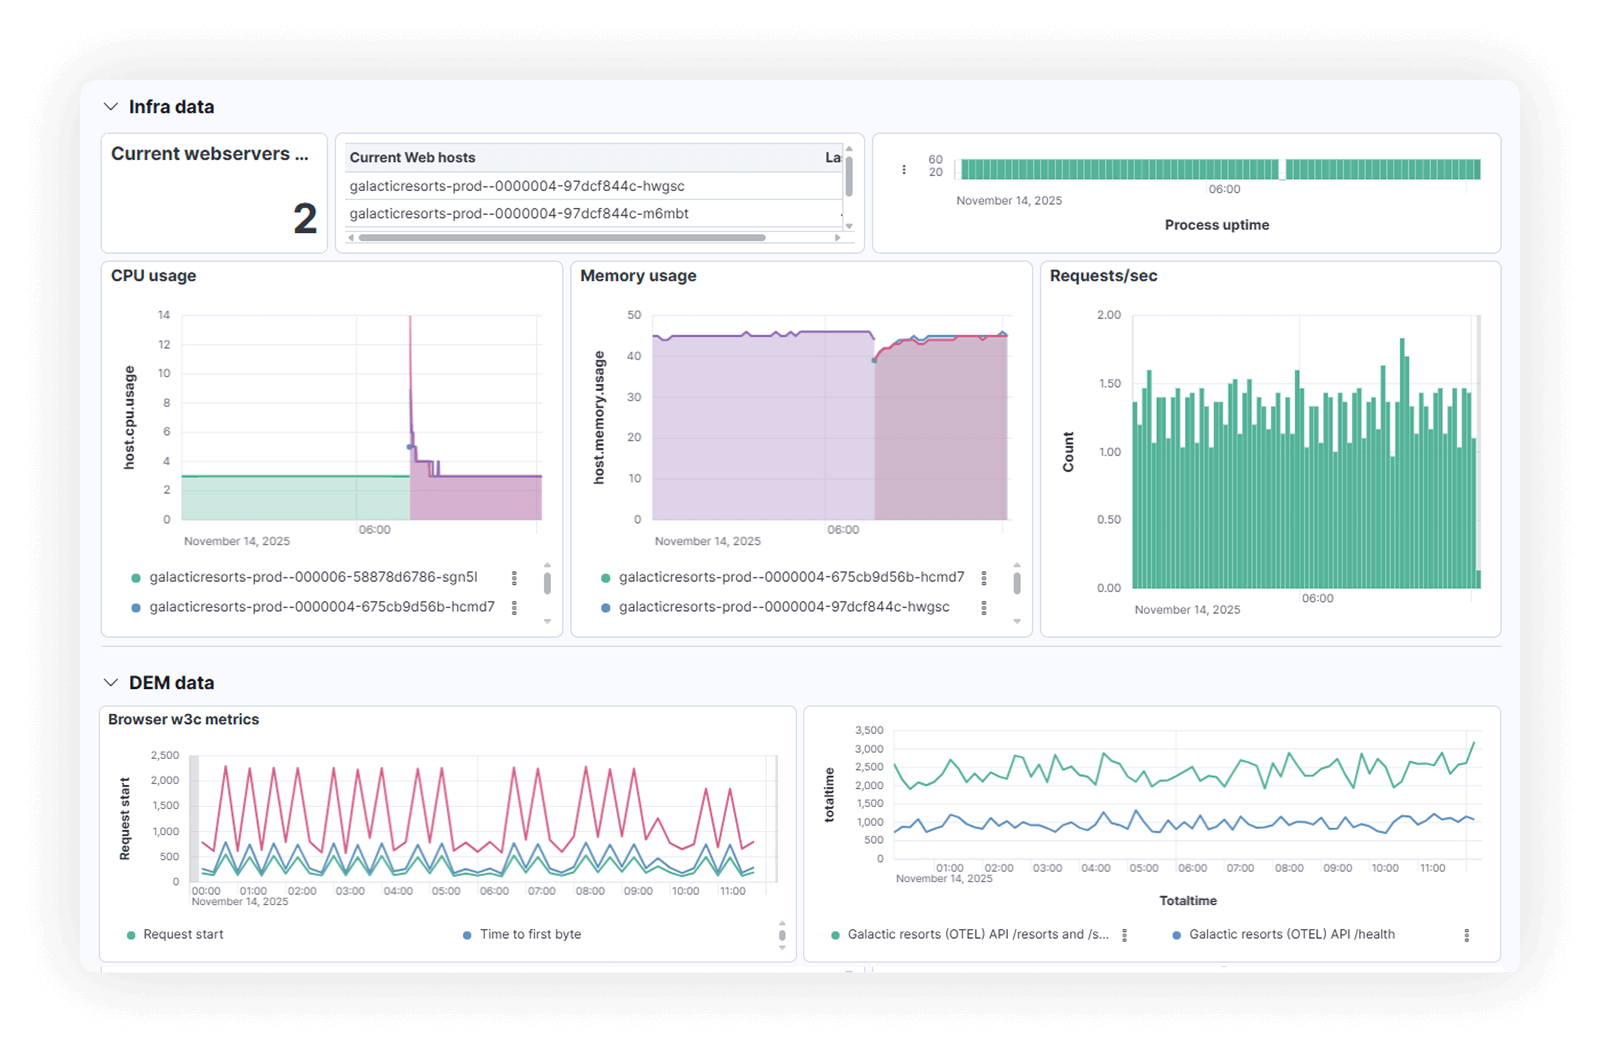
Correlate telemetry data with outside-in synthetic insights
Unify internal OpenTelemetry data with synthetic checks from end user locations, so your observability platform shows both how systems behave and what end users actually experience in a single view.

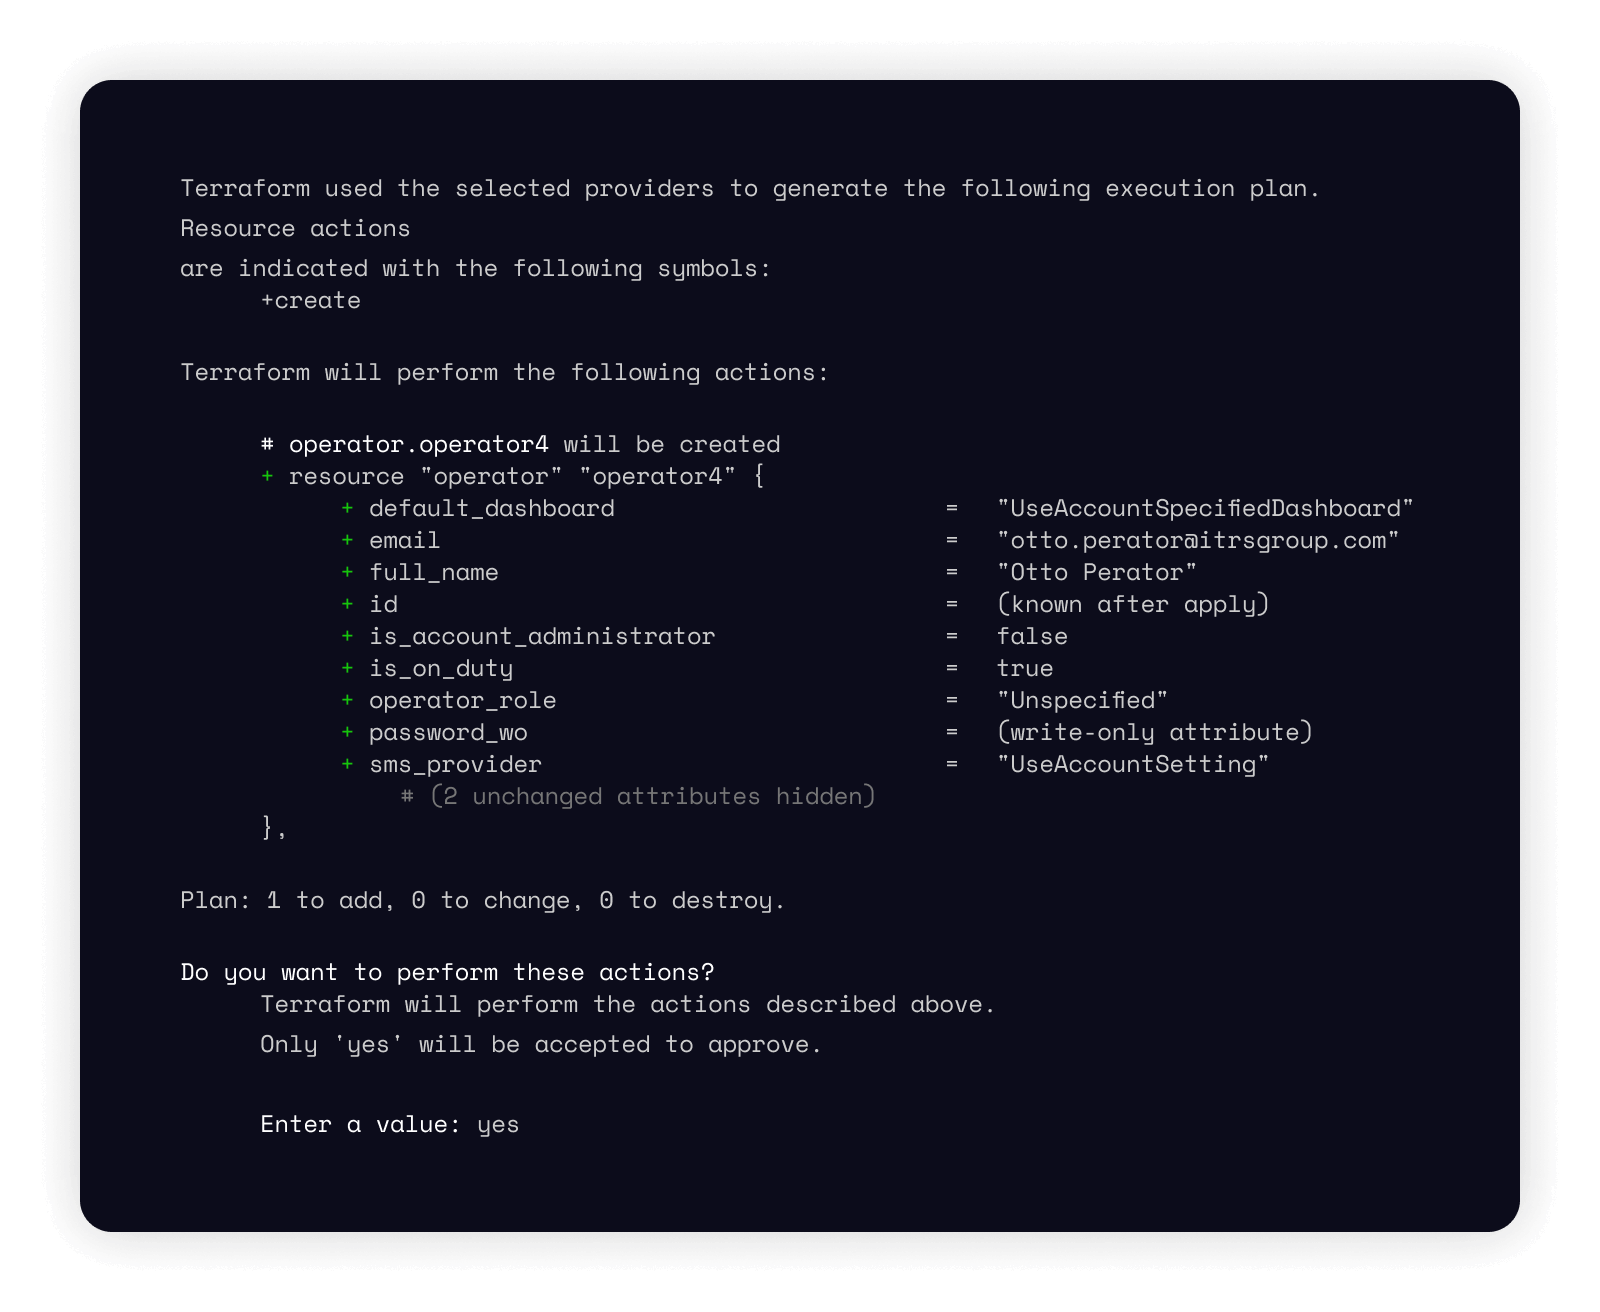
Scale reliability with monitoring as code
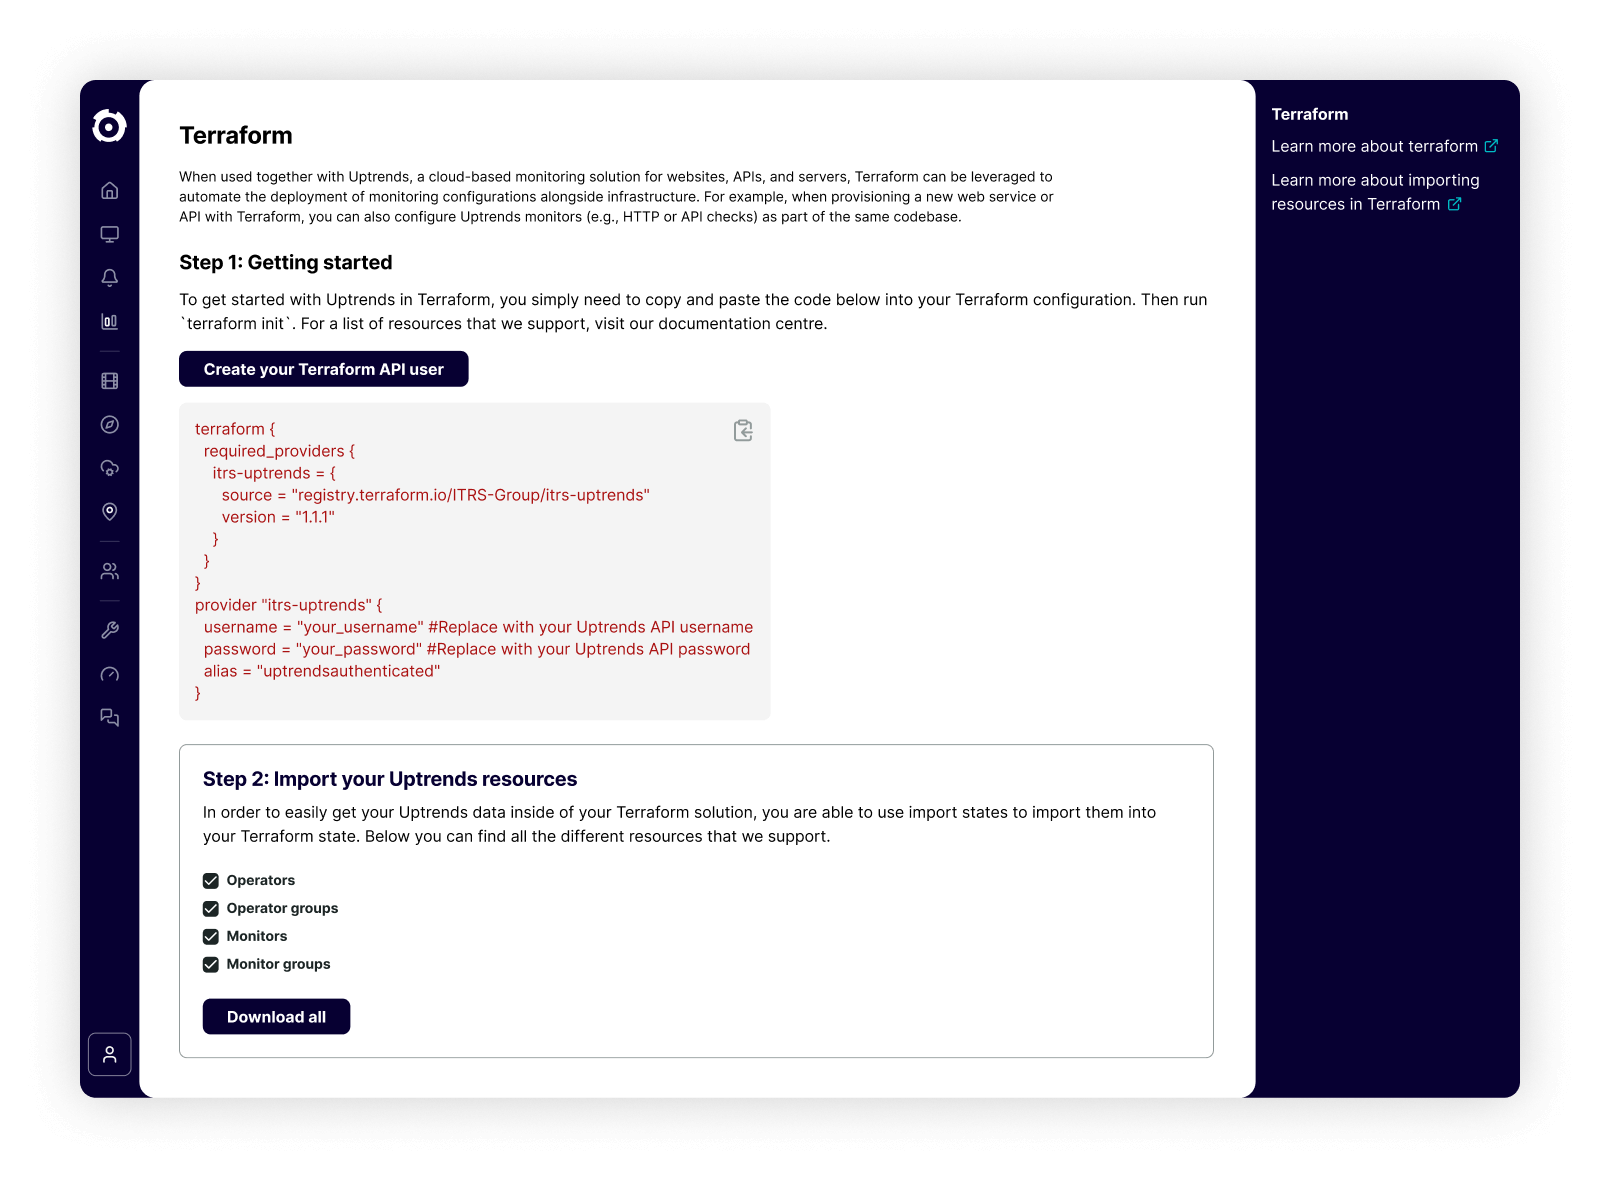
Manually managed monitors drift as teams and services grow. Use Terraform and API-driven configuration to codify DEM standards, roll them out consistently across regions, and keep coverage auditable and in sync with your platform.
Free 30-day trial
Try Uptrends free today
No credit card required, no setup headaches. Just clarity, speed, and confidence in your reliability and resilience.

Frequently Asked Questions
If you'd like a closer look or personalized guidance, we're happy to show you how Uptrends can be customized for specific use cases.
Book my 1-on-1 demoUptrends sends synthetic monitoring data into your existing OpenTelemetry-based pipelines. You can view outside-in DEM signals alongside traces, metrics, and logs in the tools you already use. Keep your current observability platform as the source of truth, while gaining an independent external signal for critical web and API journeys.
Synthetic DEM from real consumer ISP networks surfaces issues your cloud-region checks often miss: regional outages, DNS and routing problems, last-mile latency, SSO/MFA failures, and third-party dependency issues. You see where and how end users are impacted, even when your internal dashboards look healthy.
Yes, Uptrends supports monitoring as code via a Terraform Provider and APIs. Your team can define templates, policies, and guardrails once and roll them out across applications, regions, and environments. This keeps DEM configuration auditable and aligned with how you already manage infrastructure and observability in CI/CD.
Cloud and APM tools show you what’s happening inside your services and regions, but they don’t always reflect what end users experience. Uptrends adds an independent, outside-in view from test locations near end users. It validates your internal telemetry, closes regional and network blind spots, and helps teams agree quickly on where a problem really sits.
Uptrends is designed to reduce noise, not add to it. You can tune alert and severity policies so only high-signal incidents flow into your existing tools, while synthetic data itself feeds into your central dashboards via OpenTelemetry. Teams keep working where they already are with fewer false positives and clearer signals.