Harness your actual user’s experience
Harness your actual user’s experience and collect and quantify website performance and user data directly from your site’s visitors with Real User Monitoring (RUM).
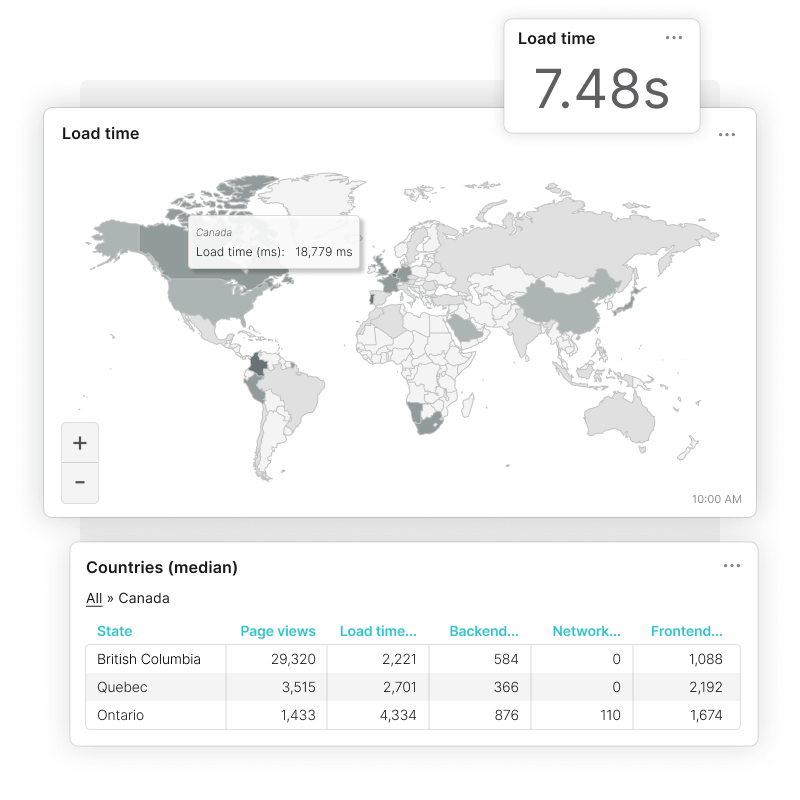
Website speed per country
- See your user concentrations and website performance based on location.
- Compare your website performance throughout different countries in the world and improve accordingly.
- Drill down to dashboards that contain data per country. Also, for Australia, Canada, and the US view data per state/province!

Load time breakdown per dimension
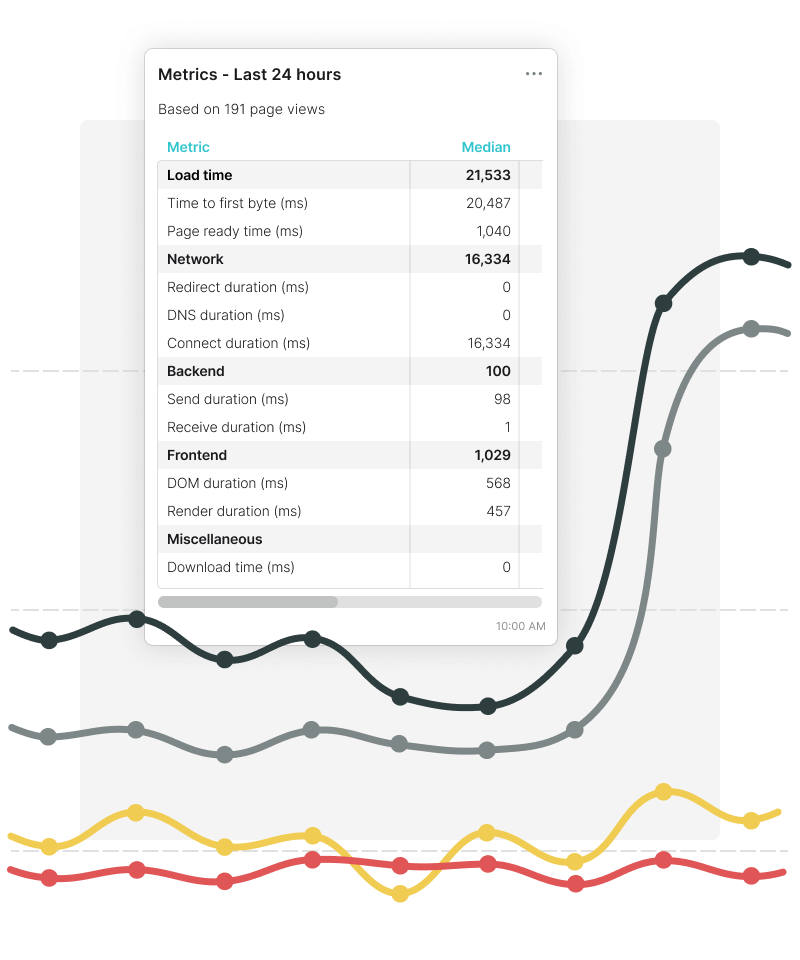
- Cut the guesswork and see in which exact corner your load time can be improved, with rich data including DOM duration, render duration, time to first byte and page ready time.
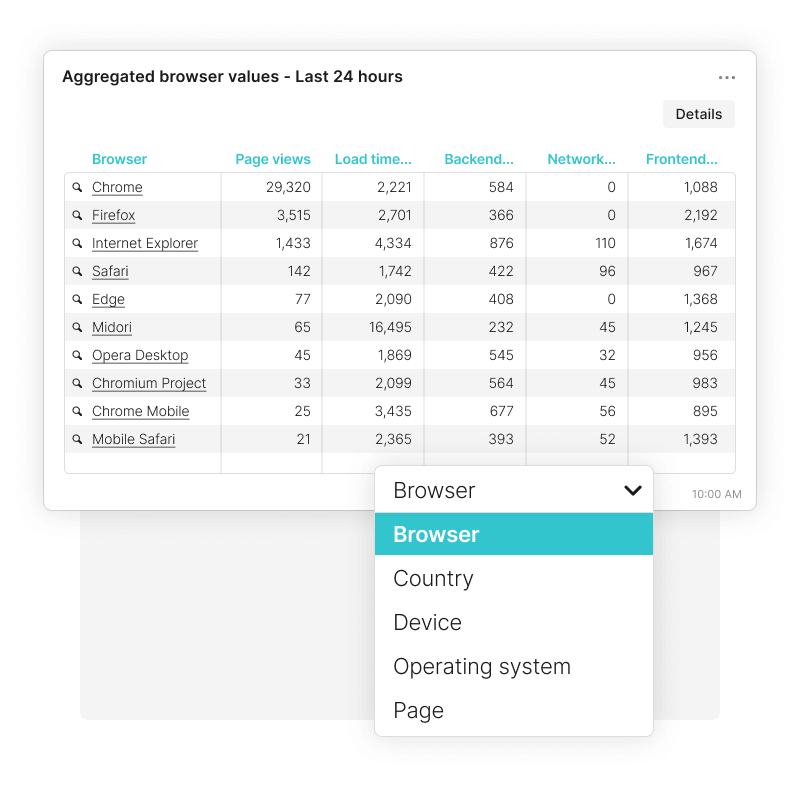
- Track which browsers and operating systems your users use to access your website and how fast your website loads for each of them.
- Monitor the true mobile experience by inspecting load times from visitors that access your websites from their mobile device.

Page views vs performance
- Get a full overview of your visited pages and see how they compare performance wise to pinpoint problem pages.
- Spot trends in your charts and quickly see your load times during peak business hours.

How it works
Setting up Real User Monitoring is quick and easy
Implement the script
Unlike Synthetic Monitoring where your site receives a check once a minute or so, Uptrends receives the data directly from your users because the script runs on your page.
Data is collected right away
Once you copy and paste the code snippet on your webpage(s), Uptrends begins receiving data about your users' experiences. Uptrends immediately parses, aggregates, and updates the data as users access your pages.
Get access to RUM dashboards
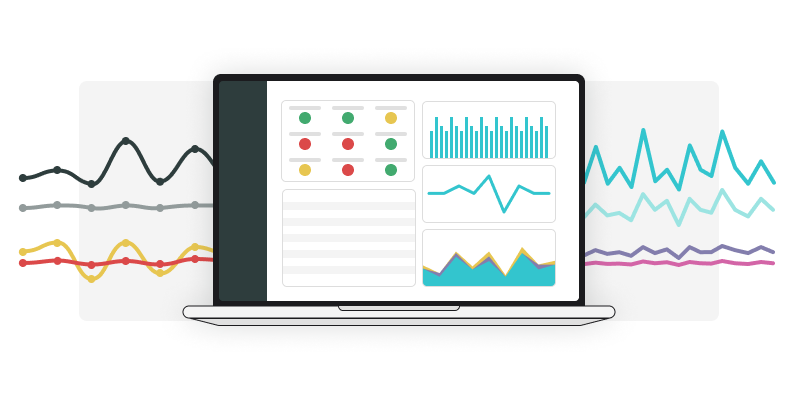
You immediately get access to a series of specialized Real User Monitoring dashboards, including world maps with performance per country, browser usage, page usage and many more.
Like yin and yang
Use RUM in combination with Synthetic Monitoring
RUM gets you data from real users when they browse your website. Synthetic Monitoring connects to your site at a specified interval, initiated by our software from one of our 229 worldwide locations. Two different approaches, but they’re most powerful when combined.

Real User Monitoring (Passive)
- View your website performance from the actual browsers, devices, and platforms your visitors are using.
- View geographical distribution of users and their load times.
- Analyze the exact breakdown (network, backend, and frontend) of load times experienced by your real users.
Synthetic Monitoring (Active)
- Validate if your site is up in a proactive fashion.
- Test website functions and predictive click paths to be notified when something breaks before your users do.
- Analyze the root cause of load time spikes with rich waterfall reports on an element level.
Collect web performance data that Google Analytics doesn’t give you
Uptrends' Real User Monitoring extends on the web analytics tools you already use. A common approach would be to use RUM to see how your website actually performs from a users' perspective, and get insight into profiling these users from tools like Google Analytics.
- Choose between the average or median values for your data. Median values are less susceptible to extreme values, giving you a better understanding of your web performance.
- No need to wait until the next day to see any results; your data is visible in your dashboards in minutes.
- See the complete picture by collecting data from all page views. No sampling here.

Got curious? Try Real User Monitoring free!
All you’ve got to do is sign up, enter your URLs, paste the RUM script into your page head, and watch the data pour in. We’ve got detailed setup instructions for you in the Knowledge Base to help you along if you need it. Go for it! No commitment and no credit card required.
Get StartedQuick take-aways in PDF format?