UPDATE
JUL 2026
#Monitor API behavior every 30 seconds
New Enterprise-level accounts can now configure multi-step API monitors to run every 30 seconds, enabling more frequent service monitoring and earlier issue detection.
Read more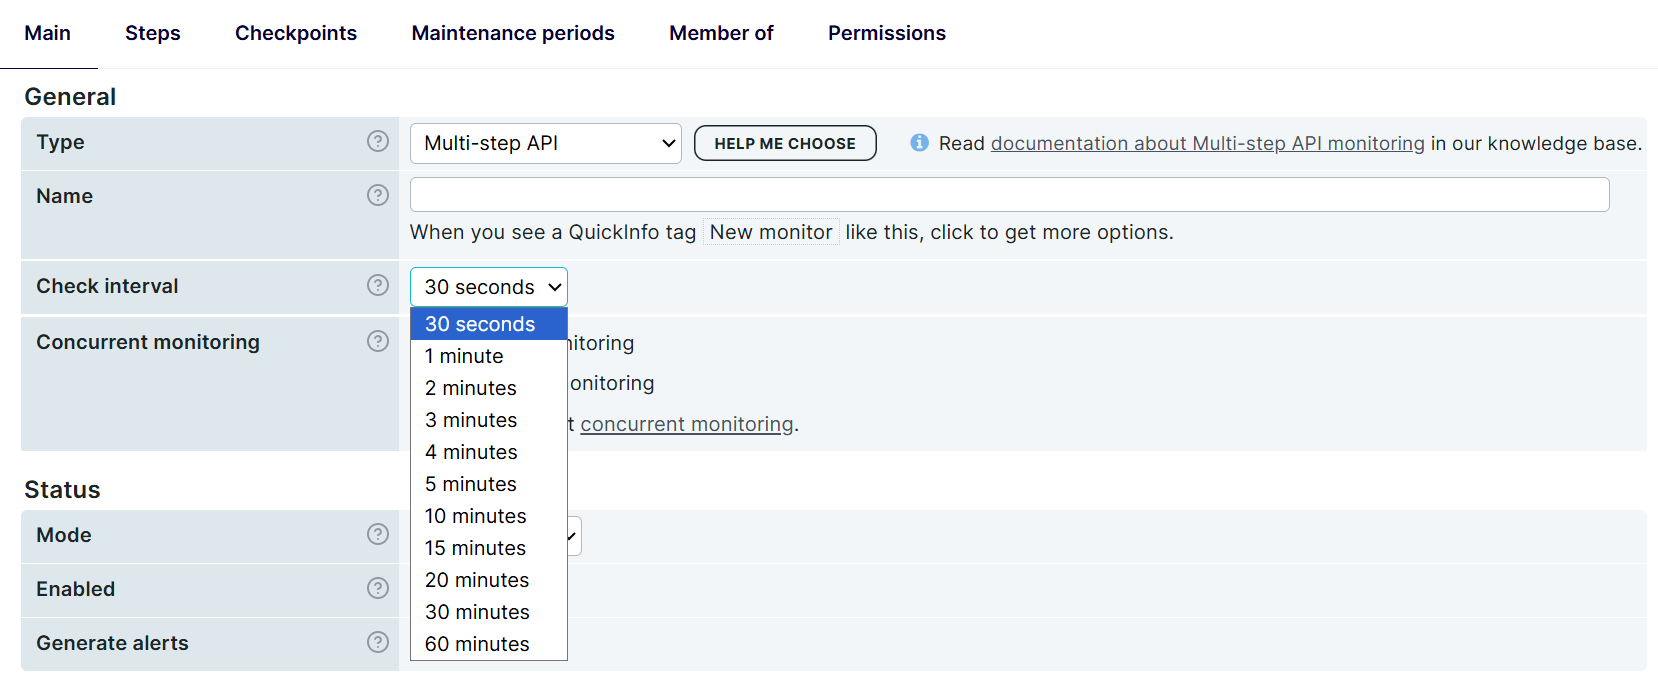
ITRS acquires IP-Label. Read the press release.
See the latest features and product updates in Uptrends
View the API changelog and reported issues in the Incident log.
UPDATE
JUL 2026
New Enterprise-level accounts can now configure multi-step API monitors to run every 30 seconds, enabling more frequent service monitoring and earlier issue detection.
Read moreUPDATE
JUL 2026
Custom integrations can now be saved as copies, enabling reuse of existing configurations instead of starting from scratch.
This option is not available for built-in integrations (email, SMS, phone) or third-party integrations requiring a dedicated setup flow, such as Slack and PagerDuty.
Read more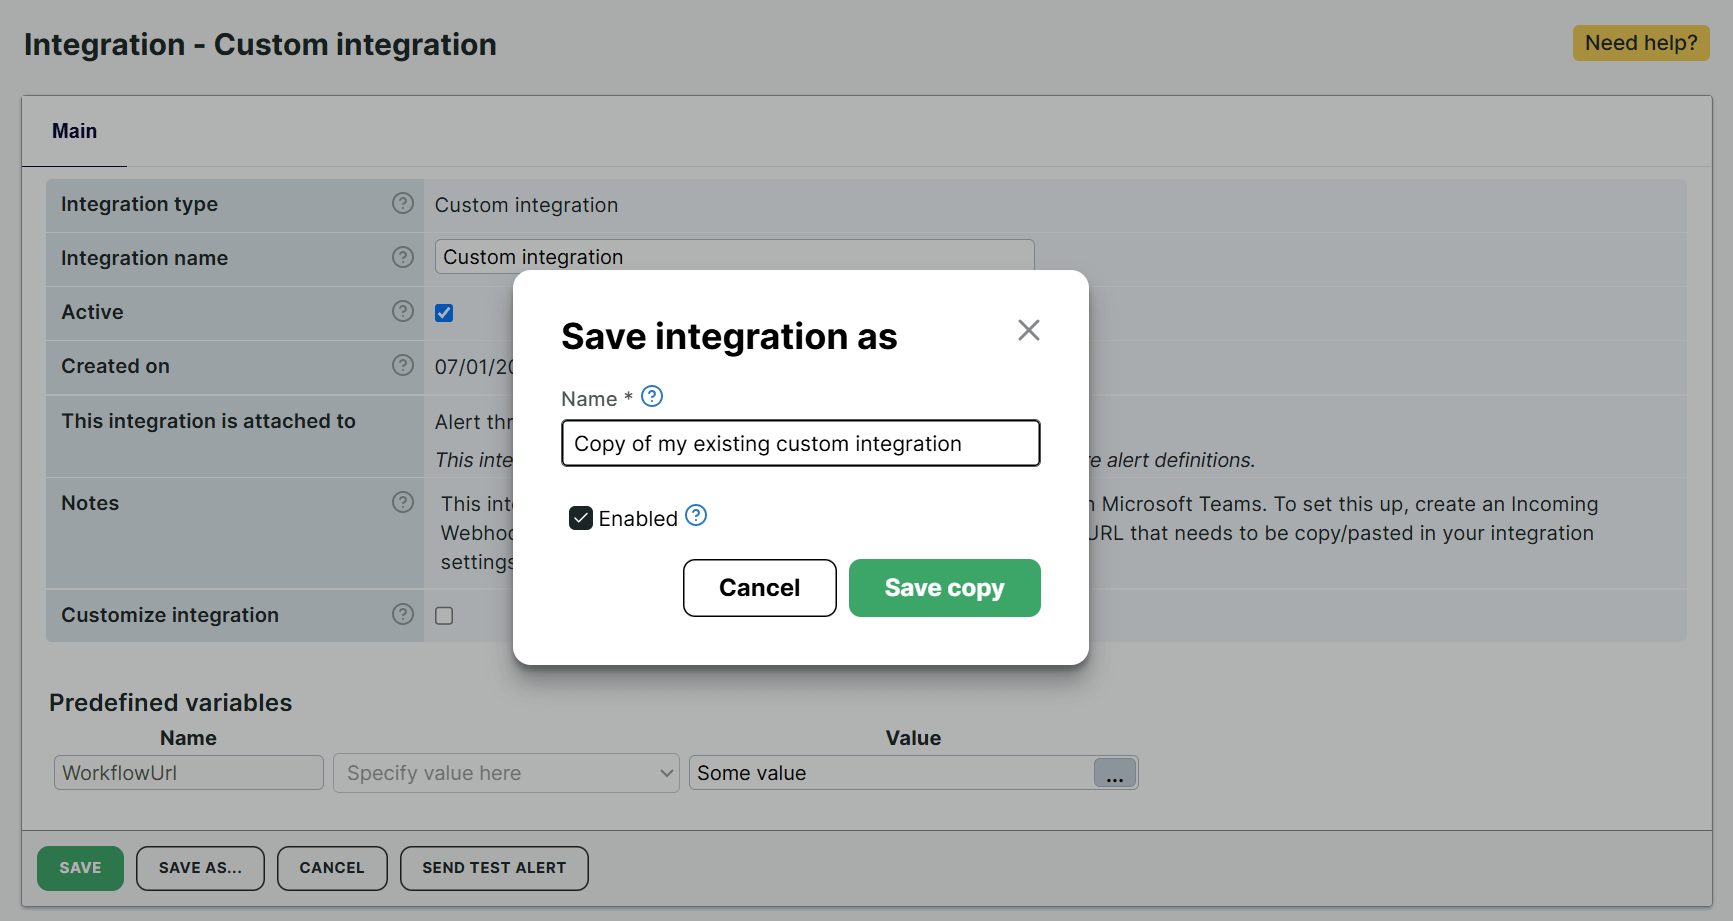
UPDATE
JUL 2026
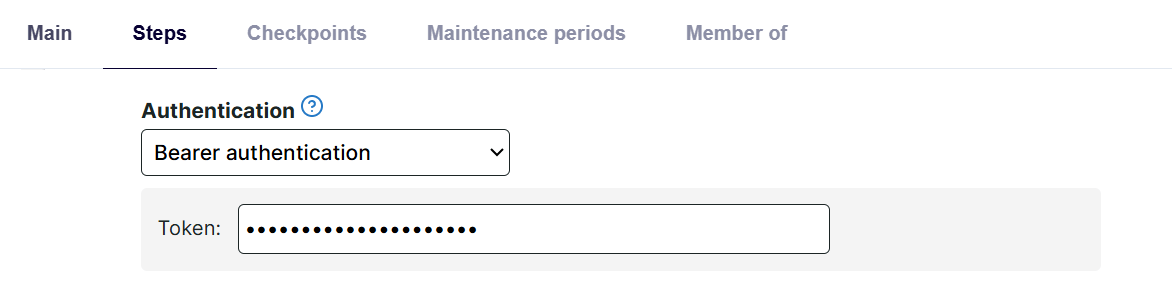
Multi-step API monitors now support Bearer authentication for individual API calls, allowing you to authenticate requests to APIs that require bearer tokens. When the token is set, Uptrends automatically includes it in the Authorization header of each API request.
NEW
JUN 2026
Uptrends now supports OpenTelemetry export for new Enterprise-level accounts.
Send monitoring results from selected monitor groups to an OpenTelemetry collector and correlate Digital Experience Monitoring (DEM) data with application, infrastructure, and log telemetry in platforms such as Elastic, New Relic, Splunk, Prometheus, or ITRS Analytics.
To enable it on your account, contact Uptrends Support or your account manager to discuss options.
Read more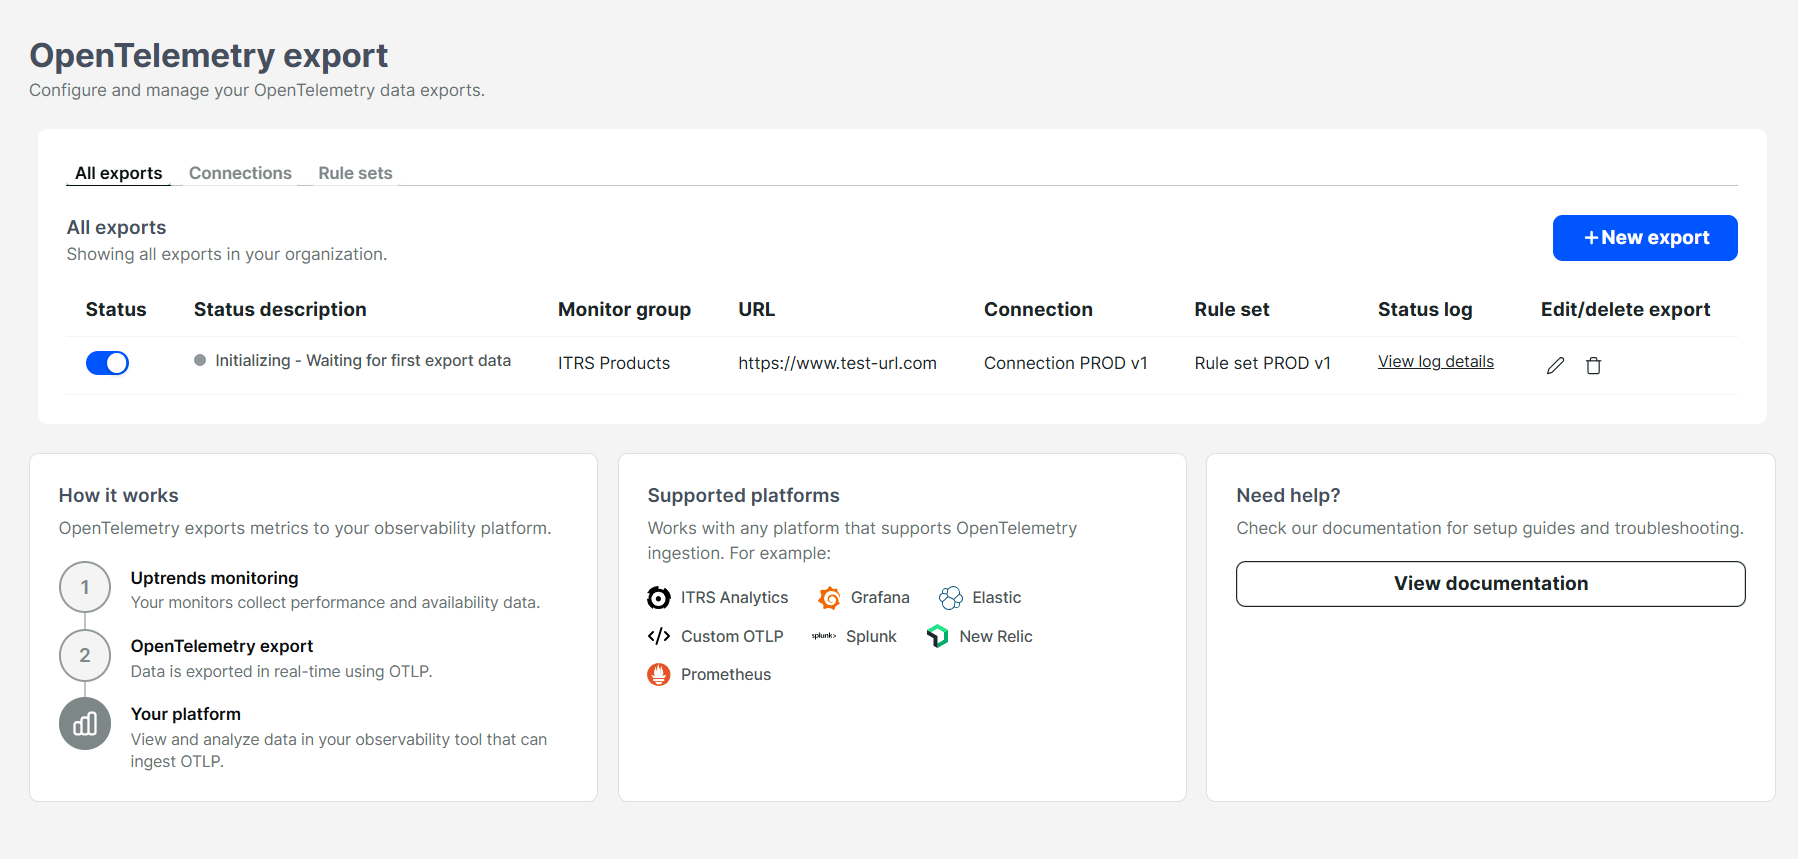
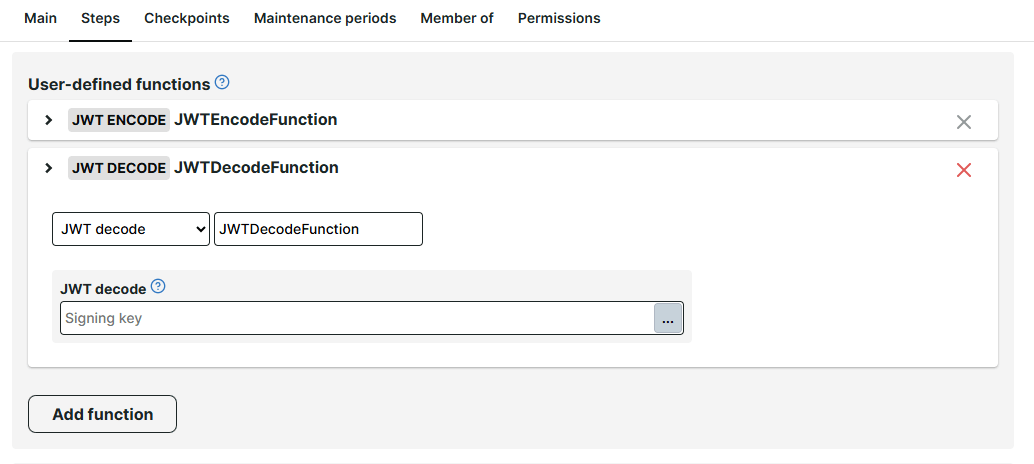
NEW
JUN 2026
Uptrends now supports JWT user-defined functions for multi-step API monitors. Use JWT Encode with a signing key to create a signed JWT for authentication. Use JWT Decode with a signing key to read the JWT and extract its information.
Read more