
Improve site health through Core Web Vitals
Gather important insights into your website’s Core Web Vitals (CWV) health with Google Chrome. Uptrends’ free CWV tool reports critical metrics like Google PageSpeed Score and can suggest performance improvements.
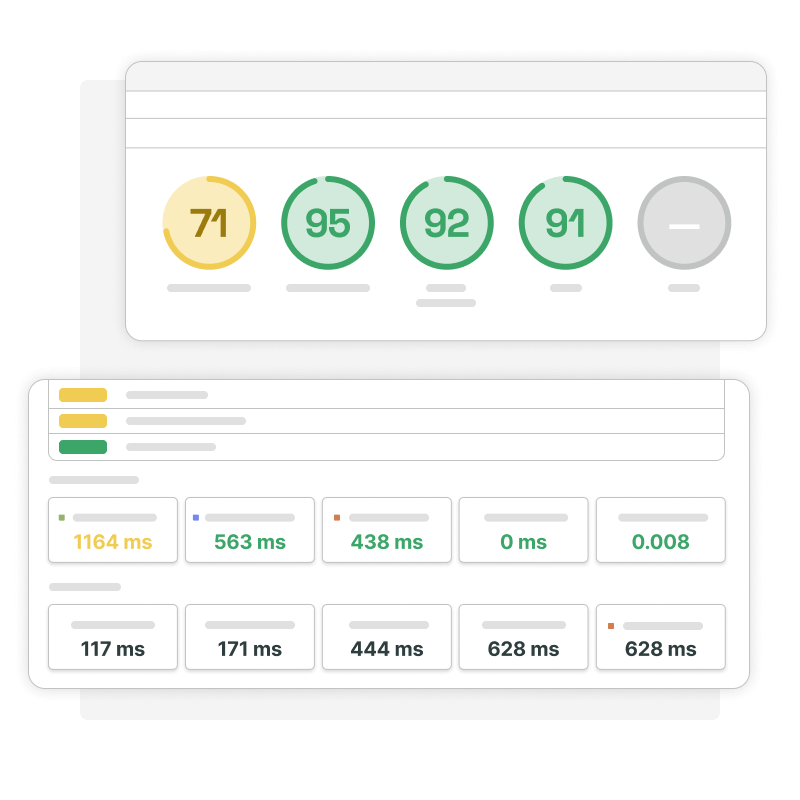
Spend time fixing unoptimized pages and improving SEO, not trying to interpret unorganized data. Uptrends reports your Google Core Web Vitals and W3C navigation timing metrics within visually-rich, colorful waterfall reports and Timeline screenshots.
Test for CWV metrics that matter most
Users find websites that are discoverable. That goes without saying. But your site’s discoverability is determined by several SEO factors, including Core Web Vitals. Uptrends’ CWV test provides results for important load events such as, Largest Contentful Paint (LCP), First Input Delay (FID), and Cumulative Layout Shift (CLS) — Google’s big three.
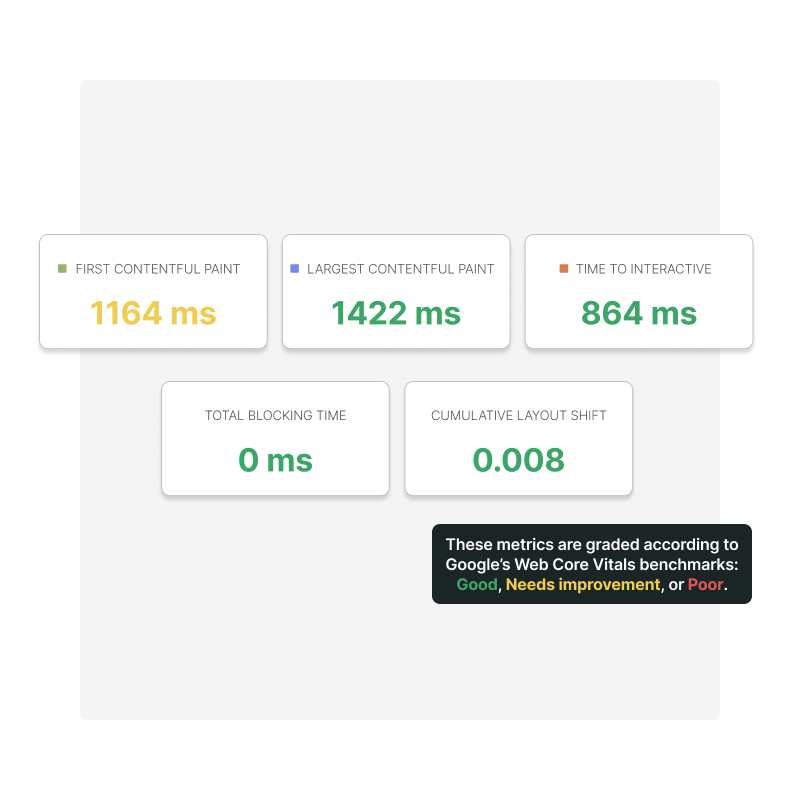
Uptrends’ CWV tool also reports non-core metrics, such as Time to Interactive (TTI) and Total Blocking Time (TBT), as provided in Lighthouse performance reports, and W3C timing metrics. The combination of these metrics provide a comprehensive and clear view into the user experience and critical SEO data given that over 85% of worldwide internet searches are handled via Google.
Largest Contentful Paint
Largest Contentful Paint (LCP) may sound overly abstract, but it simply refers to how fast meaningful content loads on your page. In particular, the time it takes for the largest single element to render on the page. To meet Google’s user experience standards, page content must load in less than 2.5 seconds. Anything slower affects your LCP score.
First Input Delay
First Input Delay (FID) measures the time it takes for a browser to respond to a site visitor’s first interaction with the site while the site is loading, also called Input Latency. User interaction can be anything from tapping a button, a keypress, clicking on a link and the resulting response. FID also measures other types of interactions, like Text input areas, dropdowns, and checkboxes.
Cumulative Layout Shift
Have you ever start reading an online article when something suddenly changes on the page? Cumulative Layout Shift (CLS) measures every unexpected layout shift that occurs during the lifespan of the page. Having page elements shift too much while a user is trying to interact with it leads to a bad user experience.
Time To Interactive
Measuring Time To Interactive (TTI) is important because some sites optimize content visibility at the expense of interactivity. This can create a frustrating user experience: the site appears to be ready, but when the user tries to interact with it, nothing happens.
Total Blocking Time
The Total Blocking Time (TBT) metric measures the total time between the First Contentful Paint (FCP) and the Time to Interactive (TTI). Any task that runs more than 50ms is considered “blocked”, which your users will perceive as a sluggish or unreliable.
Test CVW on mobile devices
Google ranks your page on its mobile speed, and mobile Internet users have surpassed desktop users to the tune of almost 15 billion devices. Get CWV mobile performance results for 3G and 4G. If you don’t know the bandwidth connection supported by your carrier, select “native speed” from the pulldown menu.
Get the same metrics from the free CWV tool reported by the desktop test using the Chrome browser. Select from dozens of supported devices and wireless bandwidths. We’ve got the most popular devices built right in for your testing — and we’re still adding more.

Timeline of screenshots
Visualize richly-detailed data with the FPC filmstrip
Sorting through unsorted, unorganized data is time-consuming and less-than-productive way to analyze and present website performance metrics for improving SEO outcomes. You need optimal visibility.
Know exactly what the page looked like at different points during its loading process. Timeline screenshots, called the filmstrip, provides the clarity you need to identify specific impact areas so your team can quickly diagnose and act on webpage performance issues.

Worldwide monitoring
Check CWV results in hundreds of global locations
The free CWV tool lets you choose from ten worldwide locations ( sign up and get access to 229 checkpoints). We locate our checkpoints on the ground in or near the cities where your users live, so you get performance data that mirrors your users' experience. Spot latency problems and fix them they affect the user experience.

Better Core Web Vitals metrics equals better SEO
Slow mobile experiences can easily hurt your website’s Google’s rankings. That’s because Google evaluates your site’s mobile experience and uses your score when deciding where you rank for a keyword. Even if you have the best content, poor mobile CWV metrics can drag you down.
Optimize with Google PageSpeed Insights
Everyone loves a fast-loading website; in fact, fast loading pages lead to higher conversions, reduced bounce rates, and better user retention. The Core Web Vitals test tool can steer you in the right direction with optimization suggestions you need to focus your efforts to get the best results.
Share your website speed test results
Do you need to save your results for later or share them with someone else to see your test results? Use the button and copy a shareable link to your clipboard. Send test result link to team members using your favorite communication channels.
Combining CWV and W3C
Harness combined CWV and W3C timing metrics
When users request a website or an application to load in a browser, steps like DNS lookups, TCP handshakes and other take place before the server returns the requested assets.
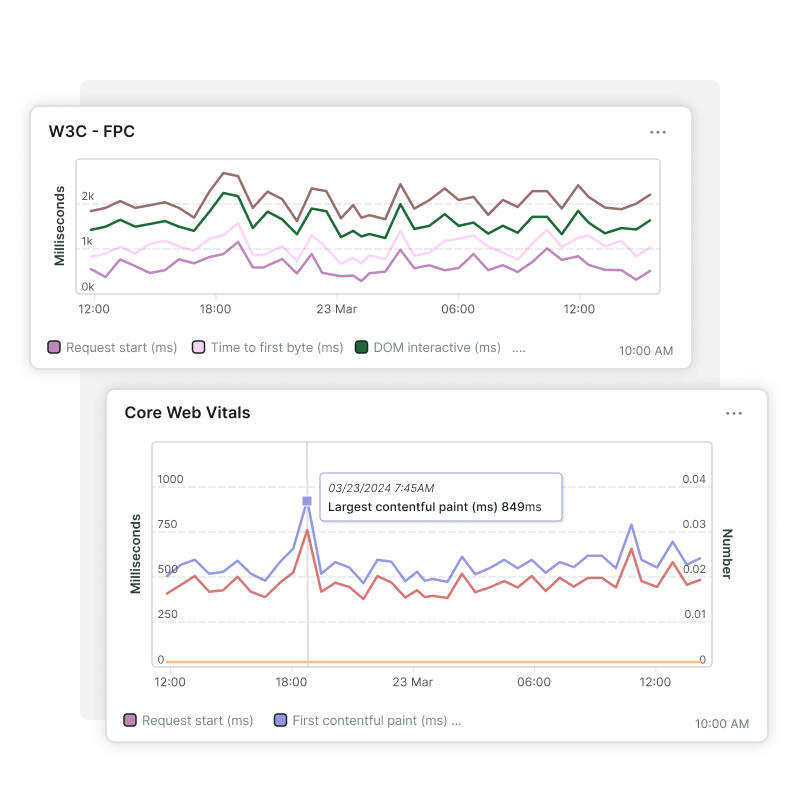
In addition to Google’s Web Core Vitals, Uptrends’ Full Page Check can also display a subset of W3C navigation timing metrics side-by-side in your dashboard. W3C navigation timing metrics consists of:
- Request start
- Time to first byte
- DOM interactive
- DOM completed
- Load event
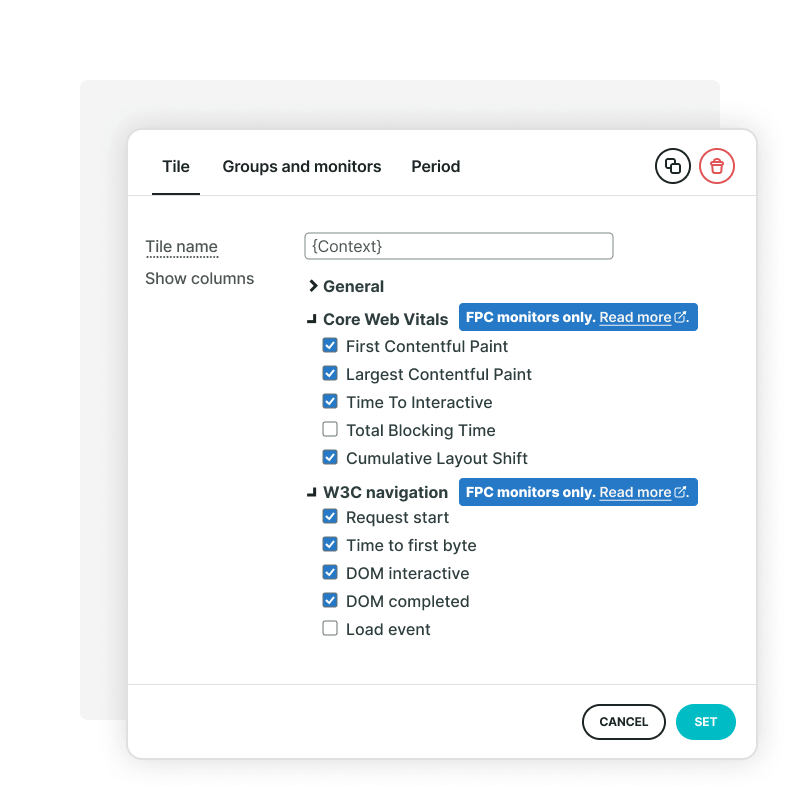
View Full Page Check metrics in custom tiles
The Full Page Check monitor with the browser type Chrome with extra metrics measures extra data for Core Web Vitals and W3C navigation timings. This data can now be shown on dashboards in a custom report tile of the type Simple data list/ chart.
Start monitoring your Core Web Vitals
Good CWV benchmarks are essential for better SEO and brand awareness. Don’t let your page performance hold you back. Try Uptrends free for 30 days, without obligations. No commitment and no credit card required.
Start a free trial