
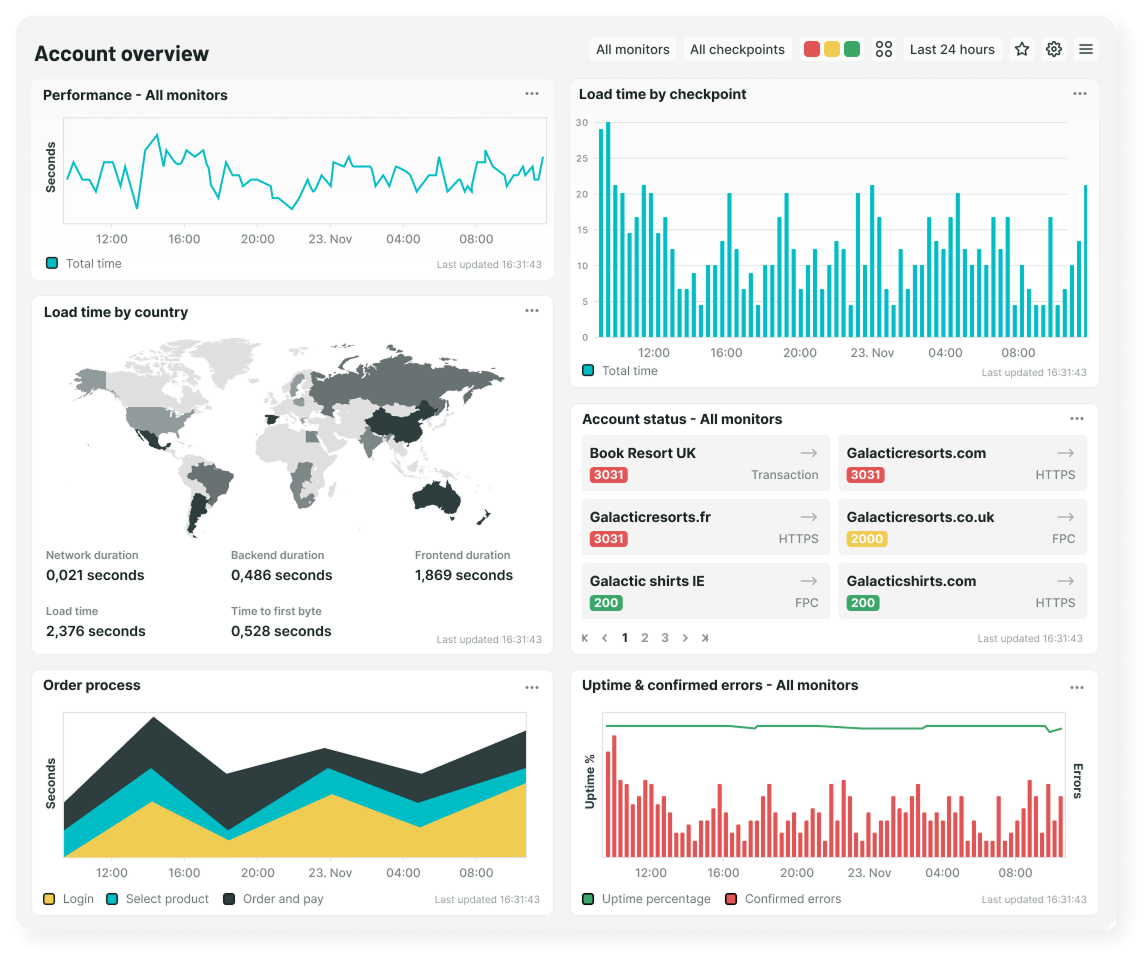
See what’s slowing you down
Performance is more than speed. It’s experience, conversion, and trust. Uptrends reveals your site’s responsiveness with real browser data and global testing. Pinpoint bottlenecks, track improvements, and prioritize fixes.
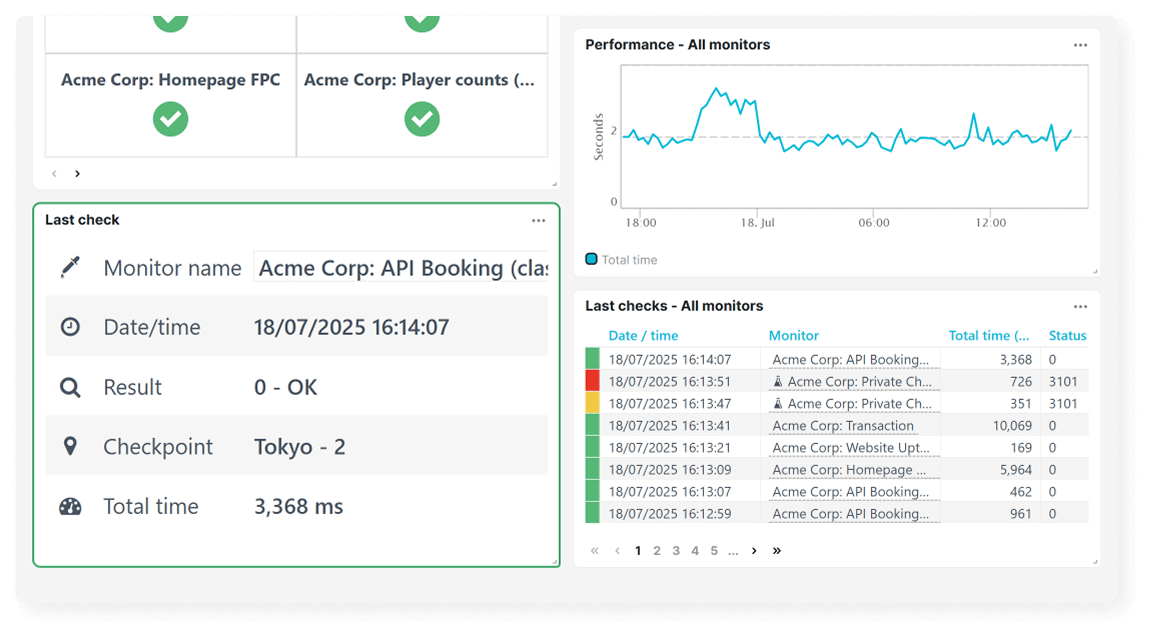
Turn diagnostics into
measurable improvements
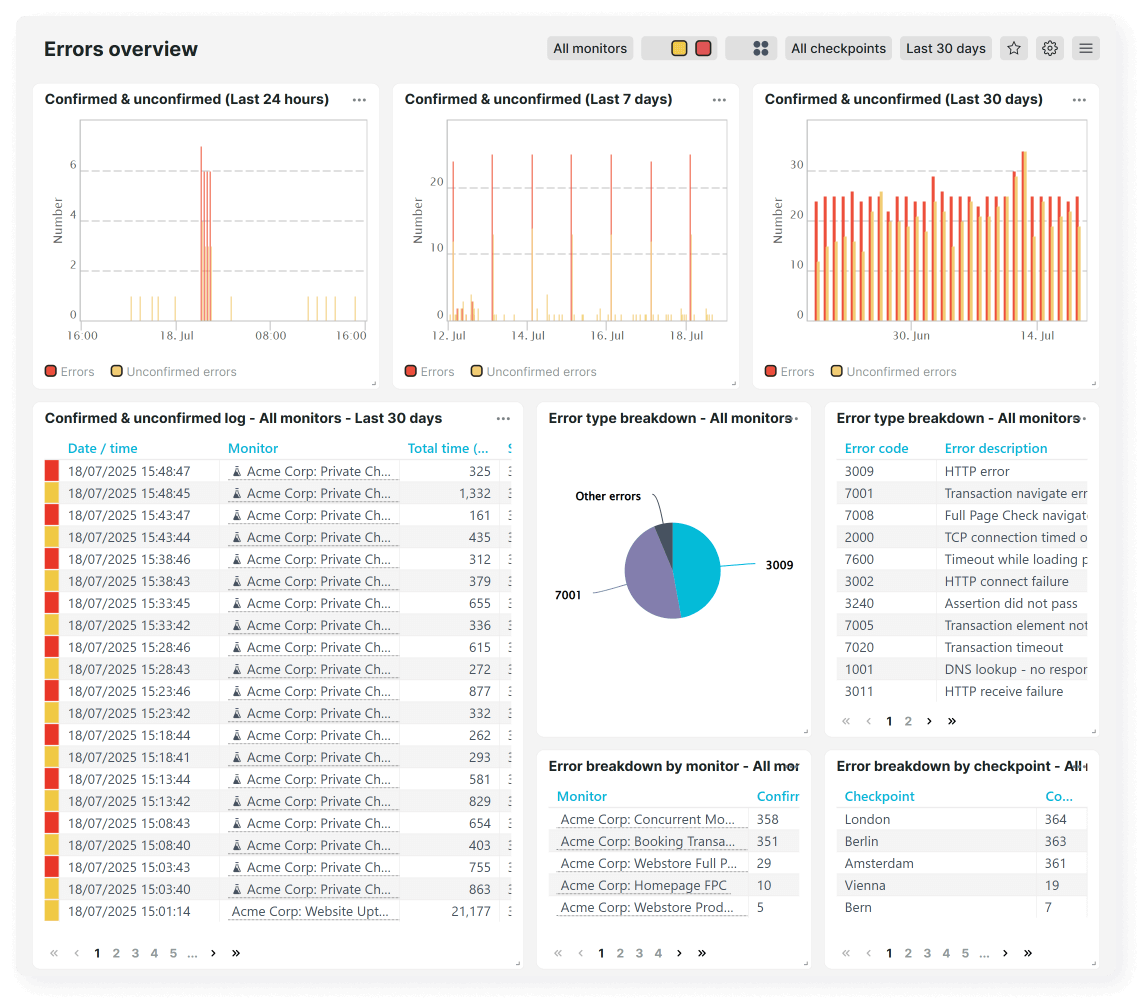
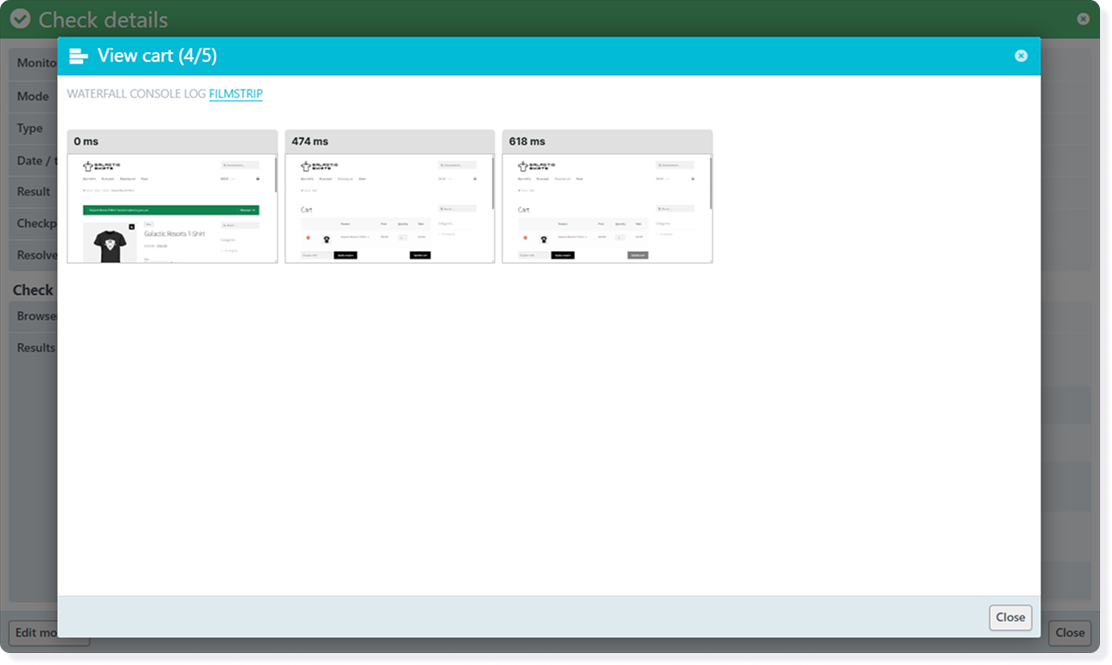
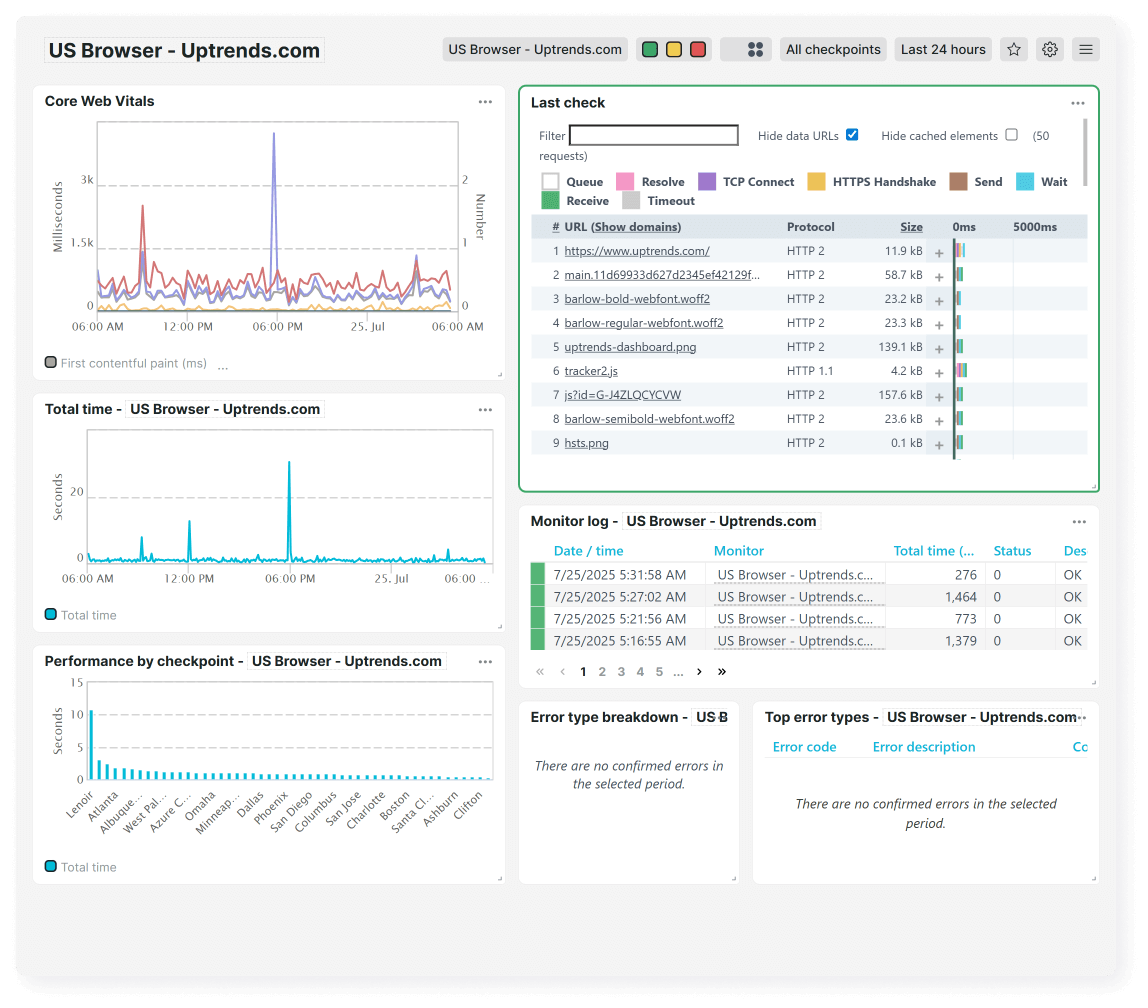
When performance dips, every detail matters. Use visual diagnostics that make it easy to spot exactly where a page, API, or script failed. With side-by-side comparisons and historical trend data, you can verify fixes and prove gains over time. All in one place.
Free 30-day trial
Try Uptrends for free
Set up your first monitor today and get 30 days of full access to Uptrends. No credit card required.

Frequently Asked Questions
If you'd like a closer look or personalized guidance, we'll be happy to show you how Uptrends can be customized for your specific needs.
Book my 1-on-1 demoUptrends runs tests in real browsers from over 230 global checkpoints, simulating how your users actually experience your site. You can segment results by location, browser, or device to identify where performance drops.
Absolutely. Uptrends provides detailed diagnostics (including waterfall charts, screenshots, and filmstrips) that show exactly where time is spent during page load. You can see which assets, scripts, or third-party services are affecting responsiveness.
We do! Uptrends measures Google’s Core Web Vitals (LCP, FID, CLS) and W3C performance metrics from real browser sessions. This helps you track critical indicators and performance improvements over time.
Website performance varies by industry, but most teams aim for a Largest Contentful Paint (LCP) under 2.5 seconds and a fully loaded time under 3 seconds. Uptrends helps you benchmark your site against industry averages and key competitors worldwide.
Use scheduled synthetic tests to track Core Web Vitals continually. Uptrends helps you validate fixes in controlled tests and see real-world improvements as users experience them.
Performance often depends on CDN coverage, routing, and third-party service latency. Uptrends’ global checkpoints help pinpoint regional slowdowns, so you can confirm whether the issue lies with your content delivery, hosting, or external dependencies.