

Central observability needs more than uptime pings
You’re building your central observability platform, but your Digital Exeperience Montioring (DEM) tool:
- Exists in silos and point solutions that slow down your observability strategy.
- Breaks or causes manual toil when testing identity-driven user journeys.
- Shows green dashboards while support teams drown in end user complaints.
Unify DEM with your open observability platform
Trust in an OpenTelemetry-compatible DEM layer that provides outside-in visibility to:
- Automate rollout across teams and services so your observability can scale.
- Reliably monitor and safeguard complex, authenticated web journeys.
- Catch and inform fixes for regional or ISP-specific issues before user impact.
Consolidation
Accelerate incident correlation with integrated DEM
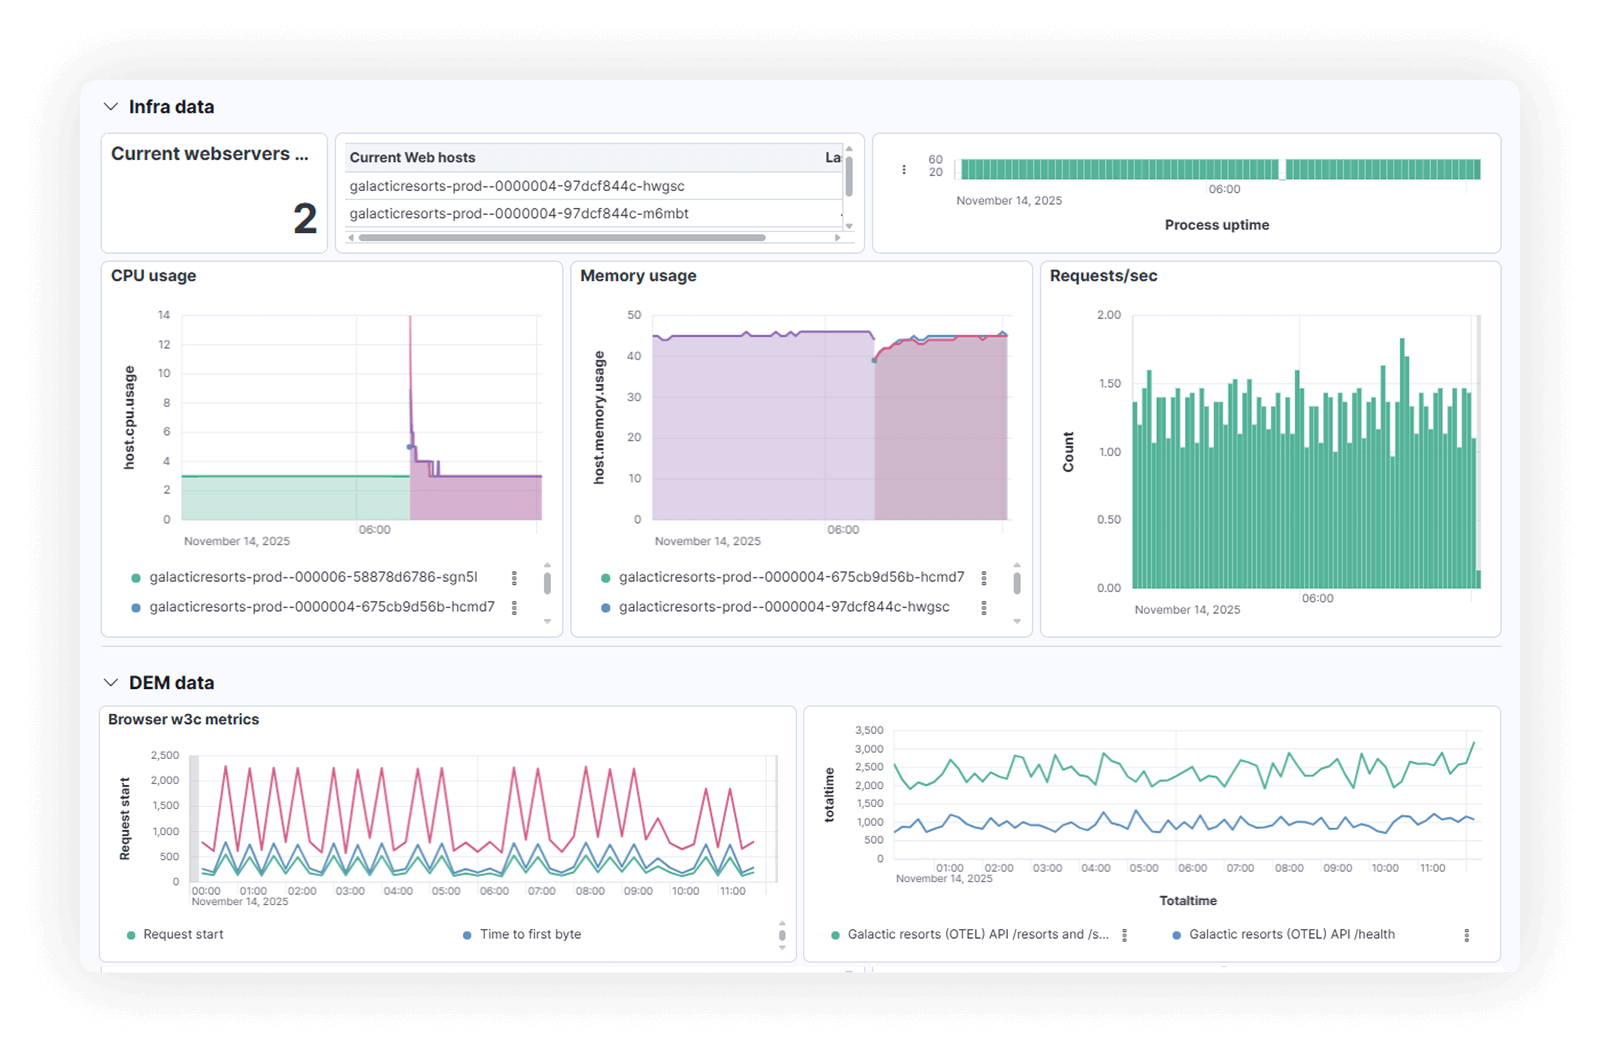
Bring outside-in DEM signals into the observability platform your product teams already live in. Provide a single source of truth so your internal customers can invest time in fixing and optimizing, not debating.
- OpenTelemetry compatibility: Integrate reliable, real-world synthetic insights into your existing platform.
- Observability-as-code: Enable product teams to manage DEM through their CI/CD pipelines with standardized templates and rules.
- Flexibile alert and severity policies: Send only high-signal incidents into your platform, not every transient check failure.
Create your first monitor in minutes
No coding required (unless you like to customize). No credit card needed.
Real-world visibility
Enable product teams to see what end users do
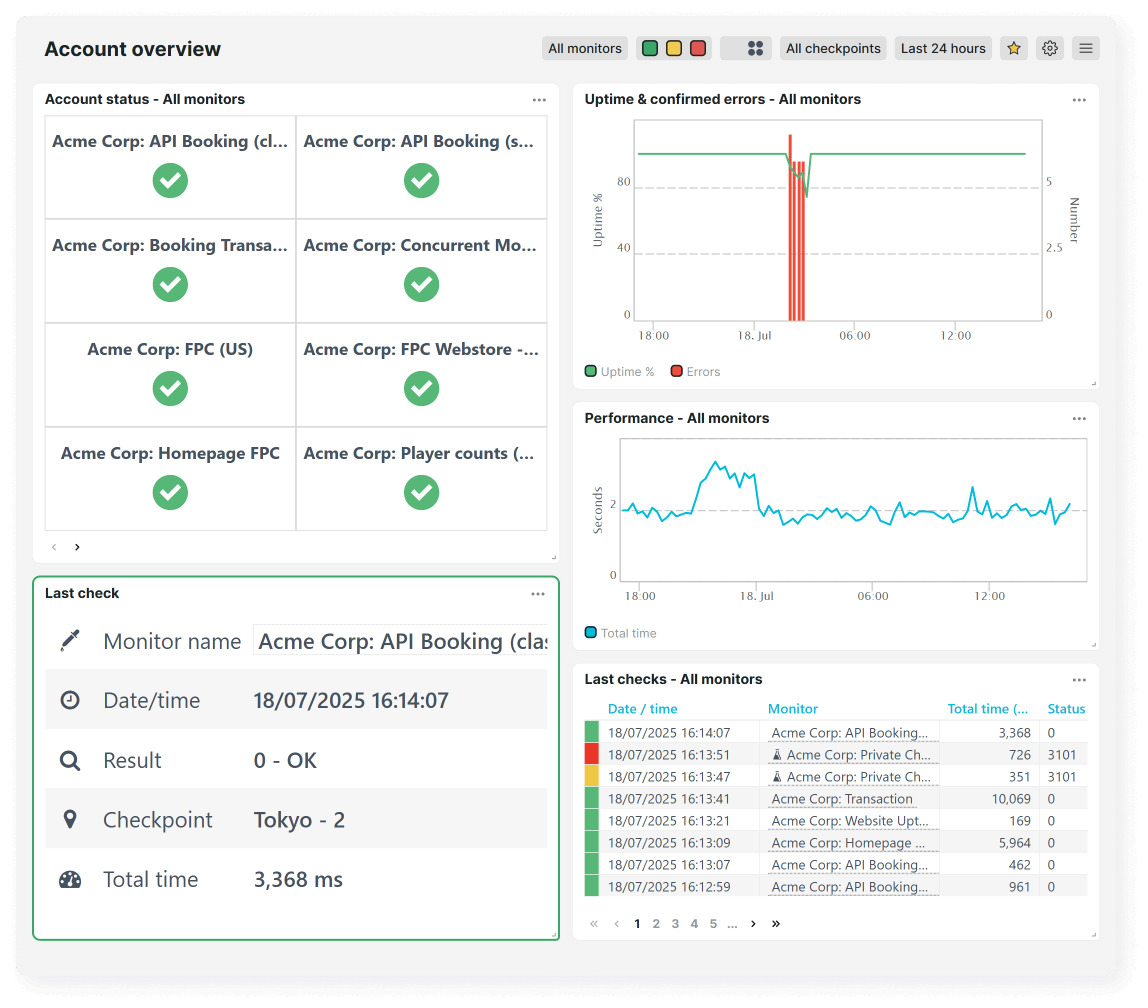
Green dashboards don’t mean reliable digital experiences. Deliver issue identification and remediation that inside-out, infrastructure-centric tools miss to protect business-critical and identity-driven journeys.
- 230+ global test locations: Surface regional performance insights from where your end users are based.
- Indepedent, ISP-based checkpoints: Run tests that follow the end user path to gain outside-in visibility of web services.
- Real-browser checks: Automate reliable tests for identity-driven user transactions that don’t set off bot detection and break.
Free 30-day trial
Try Uptrends free today
Start monitoring web services, user transactions, or APIs today and get 30 days of free access to Uptrends capabilities. No credit card required.

Frequently Asked Questions
If you'd like a closer look or personalized guidance, we'll be happy to show you how to customize Uptrends for your specific use cases.
Book my 1-on-1 demoUptrends acts as the outside-in DEM layer for your open observability stack. It runs real browser and multi-step API checks from ISP-based checkpoints and private locations, then sends results into your existing platforms via OpenTelemetry or APIS. You keep logs, traces, and infra metrics where they already live and add a trusted, external signal to validate SLOs and incident impact.
Yes! Uptrends supports monitor creation and management through Terraform, so platform teams can define standard monitor templates and roll them out as code. That means you can keep DEM definitions in version control, enforce consistency across brands and environments, and avoid configuration drift as services evolve.
Most built-in synthetics run from a few cloud regions and struggle with identity-driven journeys. Uptrends complements those checks with a broader ISP-based checkpoint network, real commercial browser tests, and low-code setup for transactions with SSO, MFA, and third-party dependencies. You get a more realistic outside-in signal that you can still route into your observability workflows.
Uptrends replaces legacy uptime and synthetic tools, becoming the single DEM layer that feeds your observability platform. Instead of every product team choosing their own basic checker, central observability teams can standardize on Uptrends and expose one reliable outside-in view across brands and regions.