

Observability now connects user clicks to backend spans
See problems sooner
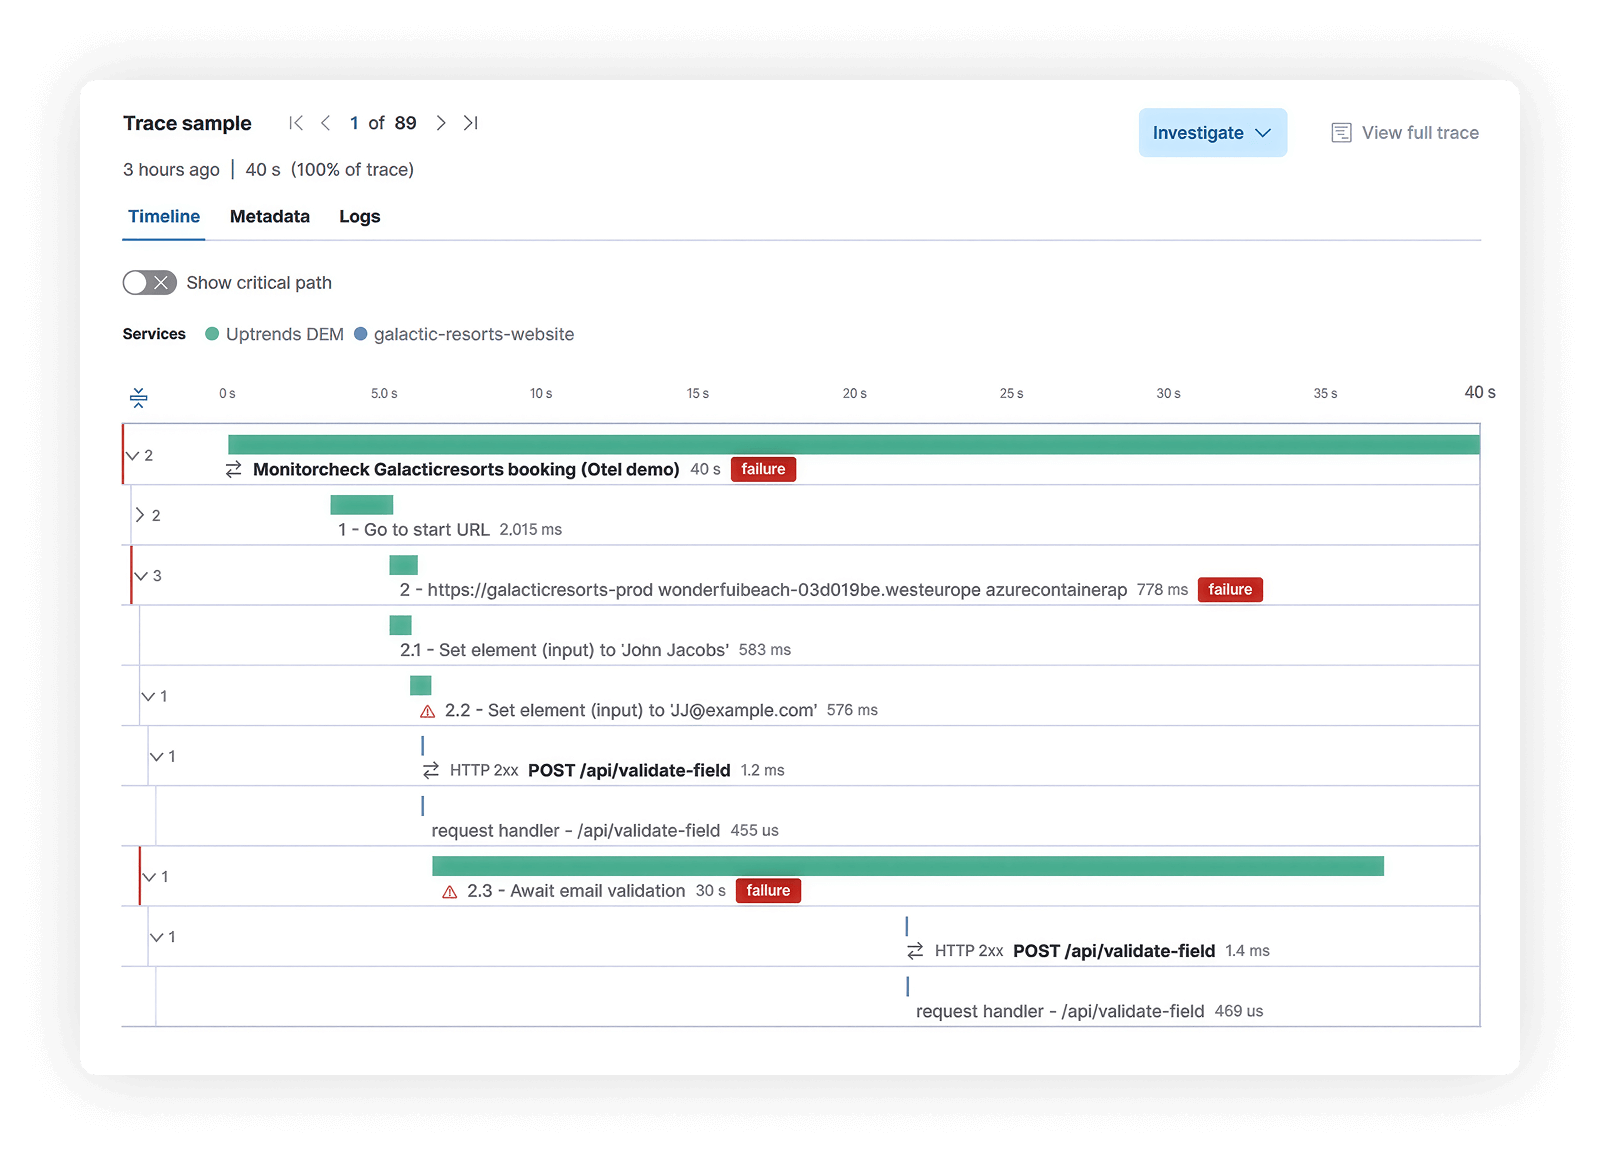
Real-browser synthetic traces appear instantly in your observability dashboards, so anomalies surface before users are affected.
Find root causes faster
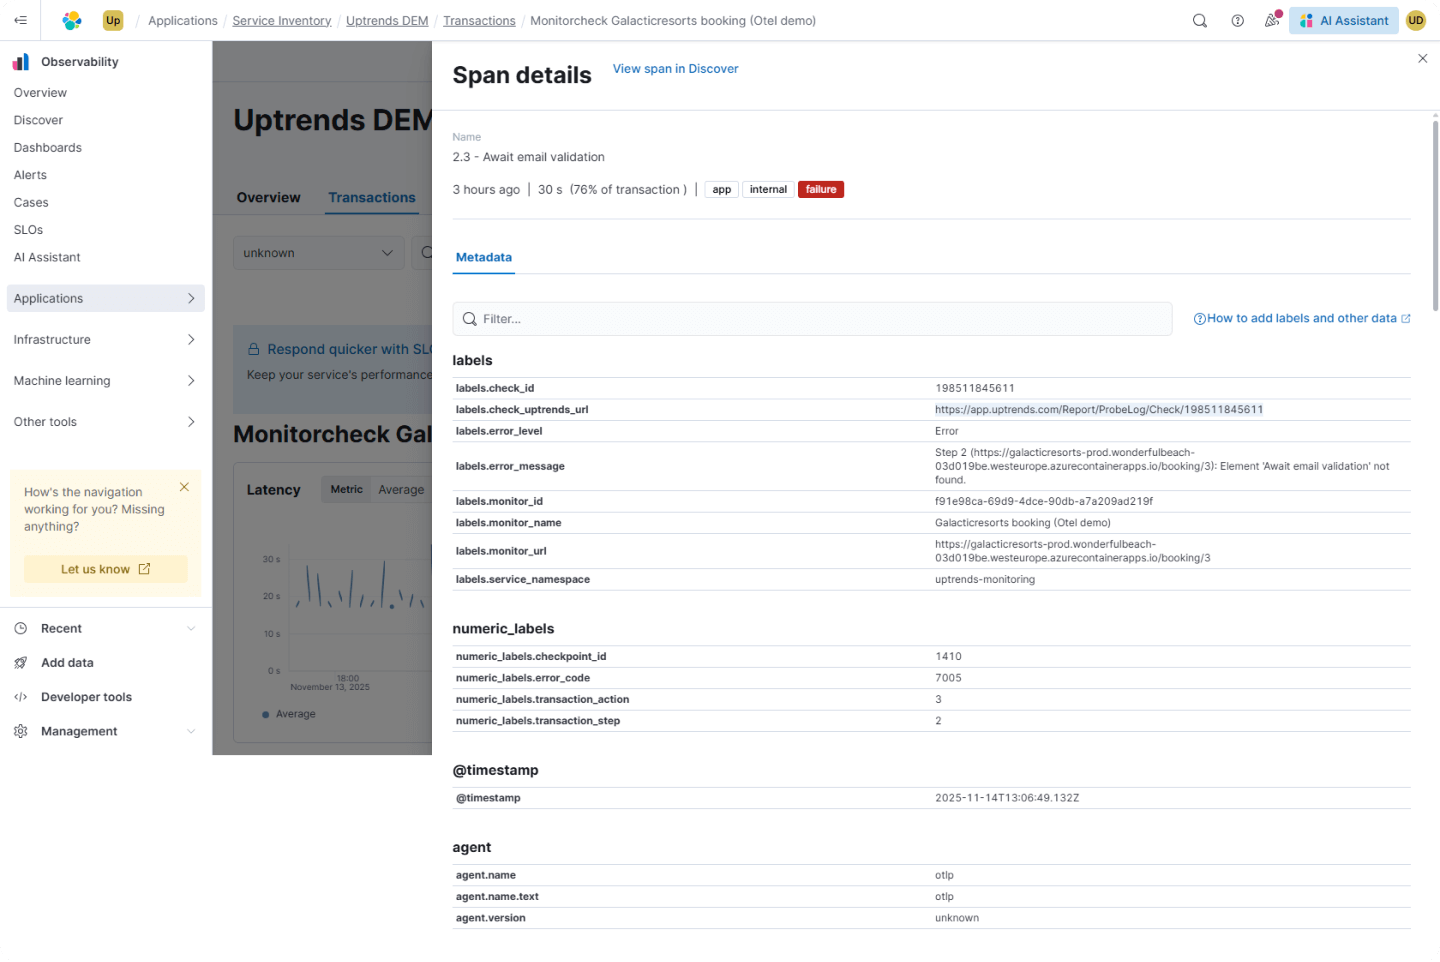
Each trace links directly to the exact Uptrends run, so you can see waterfalls and filmstrips for instant visual diagnosis.
Fix issues with less guesswork
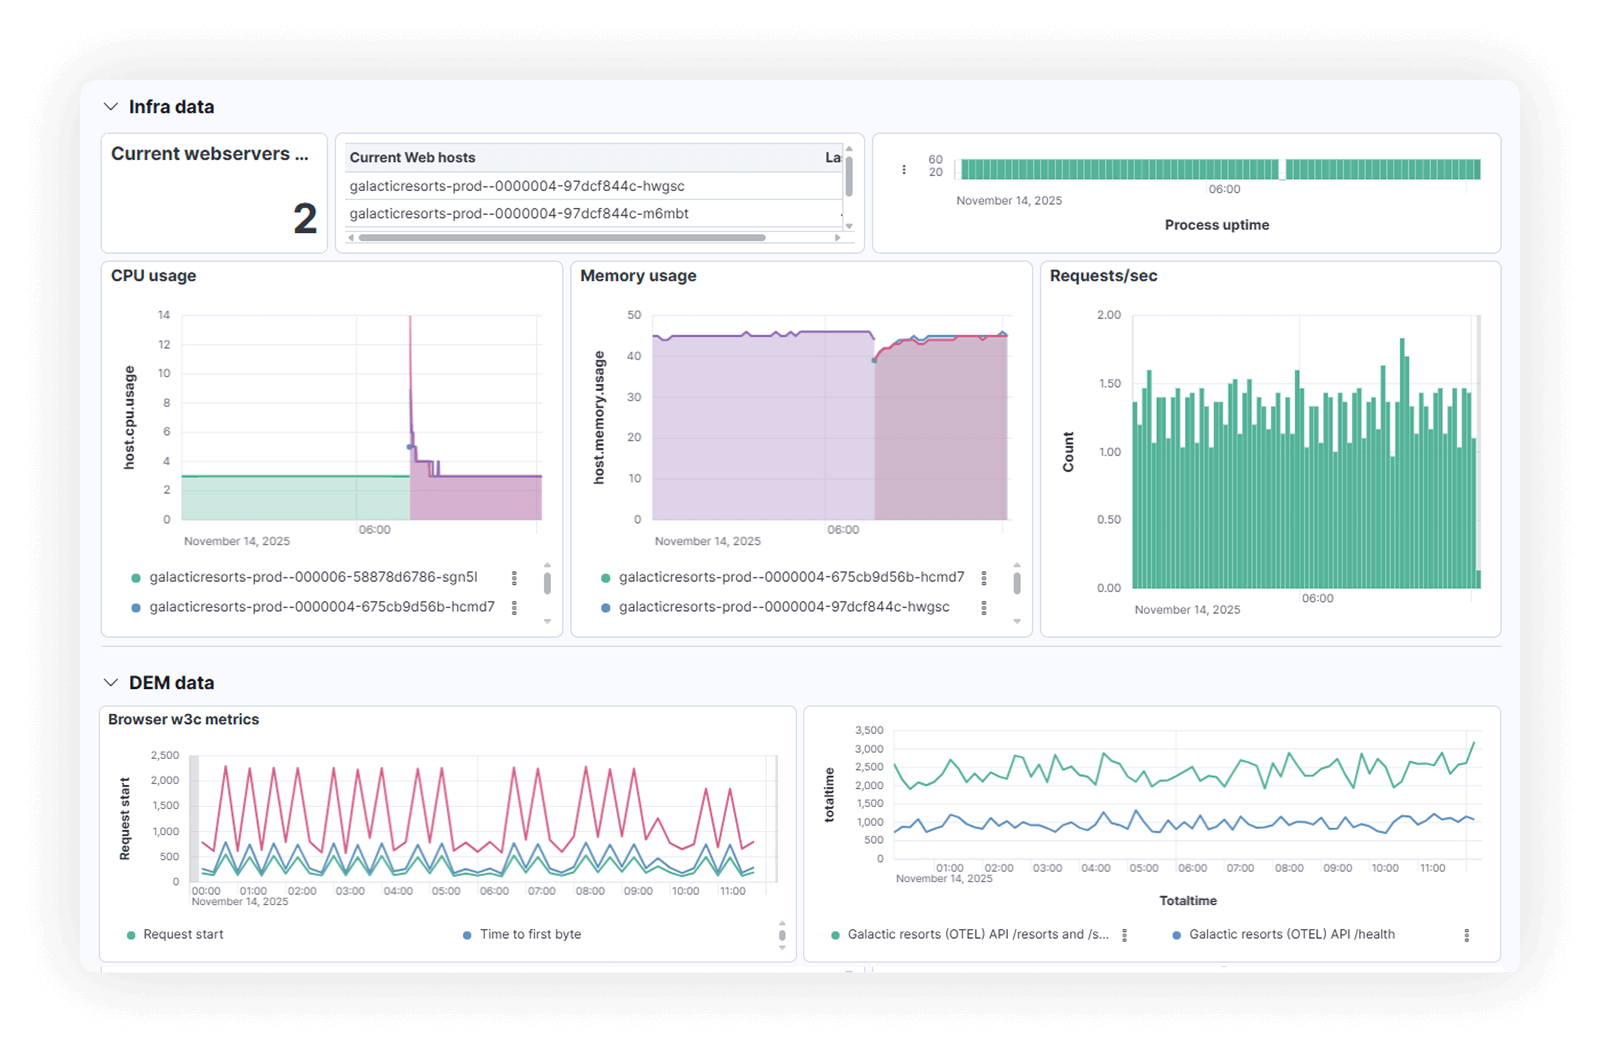
Correlated traces and metrics point you straight to the failing service, with a one-click pivot into Uptrends for full visual evidence.
Unified
Connect the dots between end users and backend systems
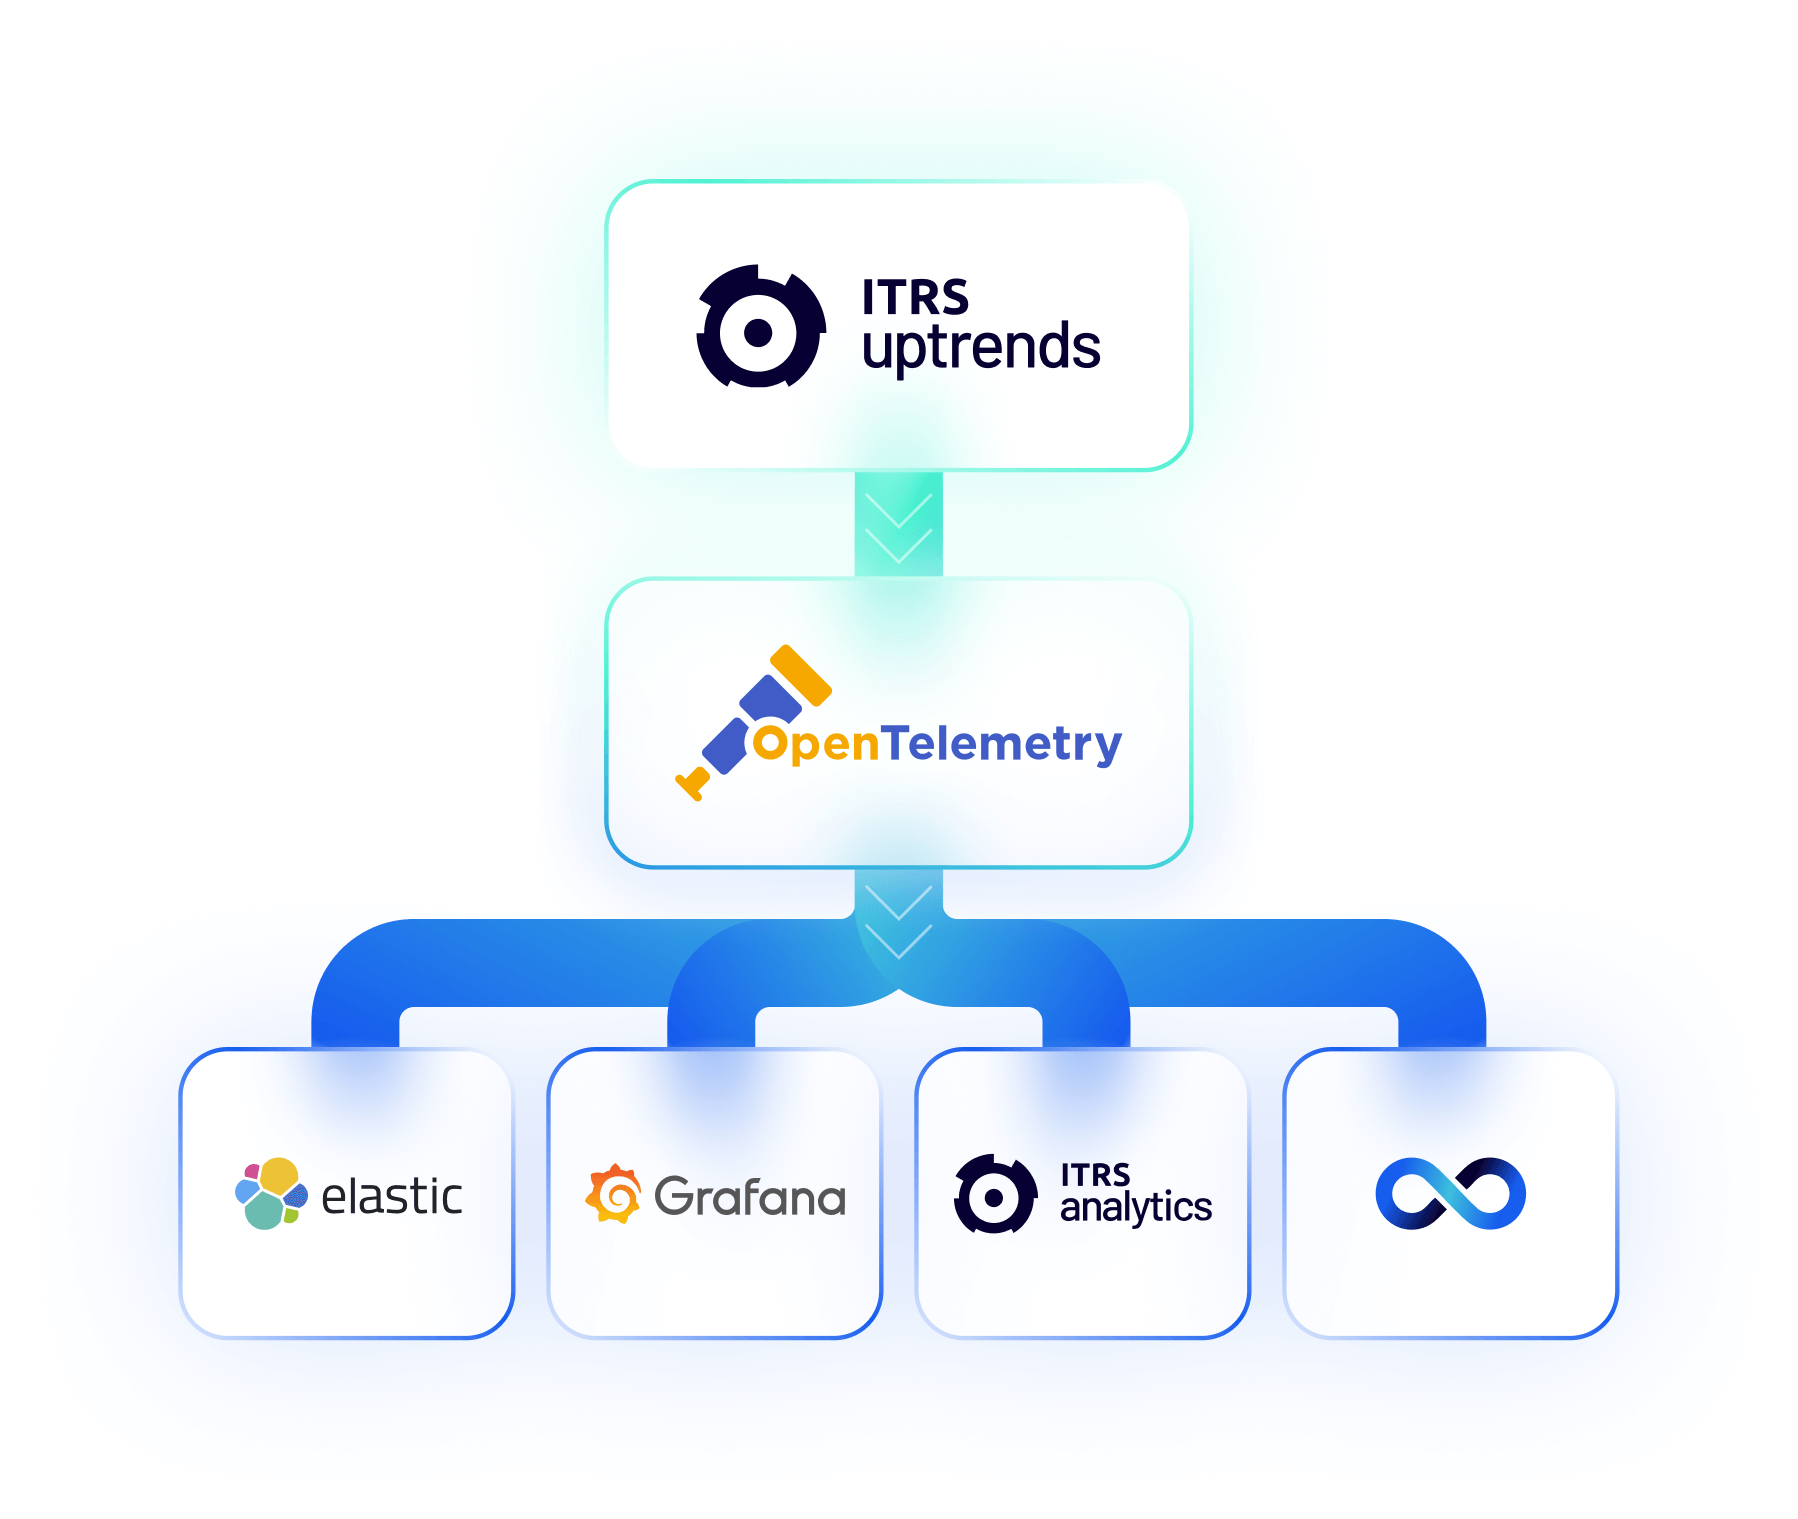
If synthetic monitoring and system telemetry live in silos, you know a flow failed but can’t see the root cause. Correlation takes hours, not clicks. With OpenTelemetry, every synthetic run becomes a trace in your observability tool.
- Trace every failure: Export synthetic results as OpenTelemetry traces to pinpoint the exact backend service that regressed.
- See what users saw: Deep-link back to the same run in Uptrends for filmstrips, waterfalls, and screenshots.
- Close the loop fast: Move from alert to root cause in one continuous flow, accelerating issue resolution.
Lightweight
Keep your ingestion lean and costs low
Pushing full browser diagnostics into observability backends floods your pipeline and inflates costs. Uptrends only sends essential traces and key metrics, while heavier assets stay safely in your synthetic monitoring tool.
- Optimize data flow: Only export traces and metrics over secure OTLP/gRPC.
- Control storage costs: Keep filmstrips and waterfalls in Uptrends for on-demand access.
- Stay performant: Maintain lean ingestion pipelines without losing diagnostic depth.
See your first synthetic trace in ITRS Analytics
Triage backend issues, see real-world impact, and verify fixes.
Platform Operators
Plug into your existing workflows
Integrating new data sources often means schema mapping, agent installs, and migration risk. Using OpenTelemetry, your high-fidelty synthetic data flows directly into dashboards, alerts, and pipelines you already use.
- Integrate cleanly: Connect any OTel-compatible backend like Grafana, Elastic, or ITRS Analytics.
- Simplify routing: Send data from specific monitor groups to different OpenTelemetry endpoints
- Manage observability as code: Use Terraform or API configs to manage monitors as code, keeping them compliant and reproducible.
Observability Leaders
Drive efficiency, consistency, and control at scale
Managing observability at scale means balancing visibility, governance, and cost across global teams and environments. OpenTelemetry compatibility helps you bring real-browser synthetic insights into your unified observability strategy.
- Streamline architectures: Consolidate Digital Experience Monitoring into your observability platform to reduce tool sprawl.
- Future-proof investments: Align with open standards like OpenTelemetry to keep data portable as your stack evolves.
- Strengthen governance: Establish consistent, auditable data practices across regions and business units.
Free 30-day trial
Try Uptrends free today
Start monitoring your web services with Uptrends and get 30 days of free access. No product limitations. No credit card needed.

Frequently Asked Questions
If you'd like a closer look or personalized guidance, we'll be happy to show you how Uptrends can be customized for your specific needs.
Book my 1-on-1 demoMost observability tools run simple HTTP checks from within their own cloud. Uptrends tests real user journeys in the latest browser versions from global, non-cloud checkpoints, capturing what users actually experience (including MFA and SSO flows). The result: higher accuracy, stronger evidence, and better correlation with real-world performance in production.
Because traces from synthetic checks reveal where an issue begins, even when no live traffic is hitting that path. By correlating synthetic traces with backend spans, SREs can spot regressions earlier and test fixes before end users are impacted.
The integration covers Uptime, Browser, Transaction, and Multistep API (MSA) monitors. Each run can export its result as an OpenTelemetry trace and key metrics, letting you analyze synthetic checks for web, API, and end-to-end user transactions inside your observability dashboards.
Synthetic data is transmitted over a secure OTLP/gRPC endpoint using either API key or username/password authentication. Only traces and lightweight metrics are sent to keep ingestion lean and secure.
Uptrends gives you full visibility without overwhelming your observability pipeline. Only lightweight OpenTelemetry traces and key metrics are exported, not heavy assets like filmstrips, waterfalls, or screenshots. Those stay securely in Uptrends and are accessible via a deep link in each trace. This approach keeps your ingestion lean, your dashboards responsive, and your storage costs predictable.