
Connect frontend signals…
End-to-end visibility into your user journey.
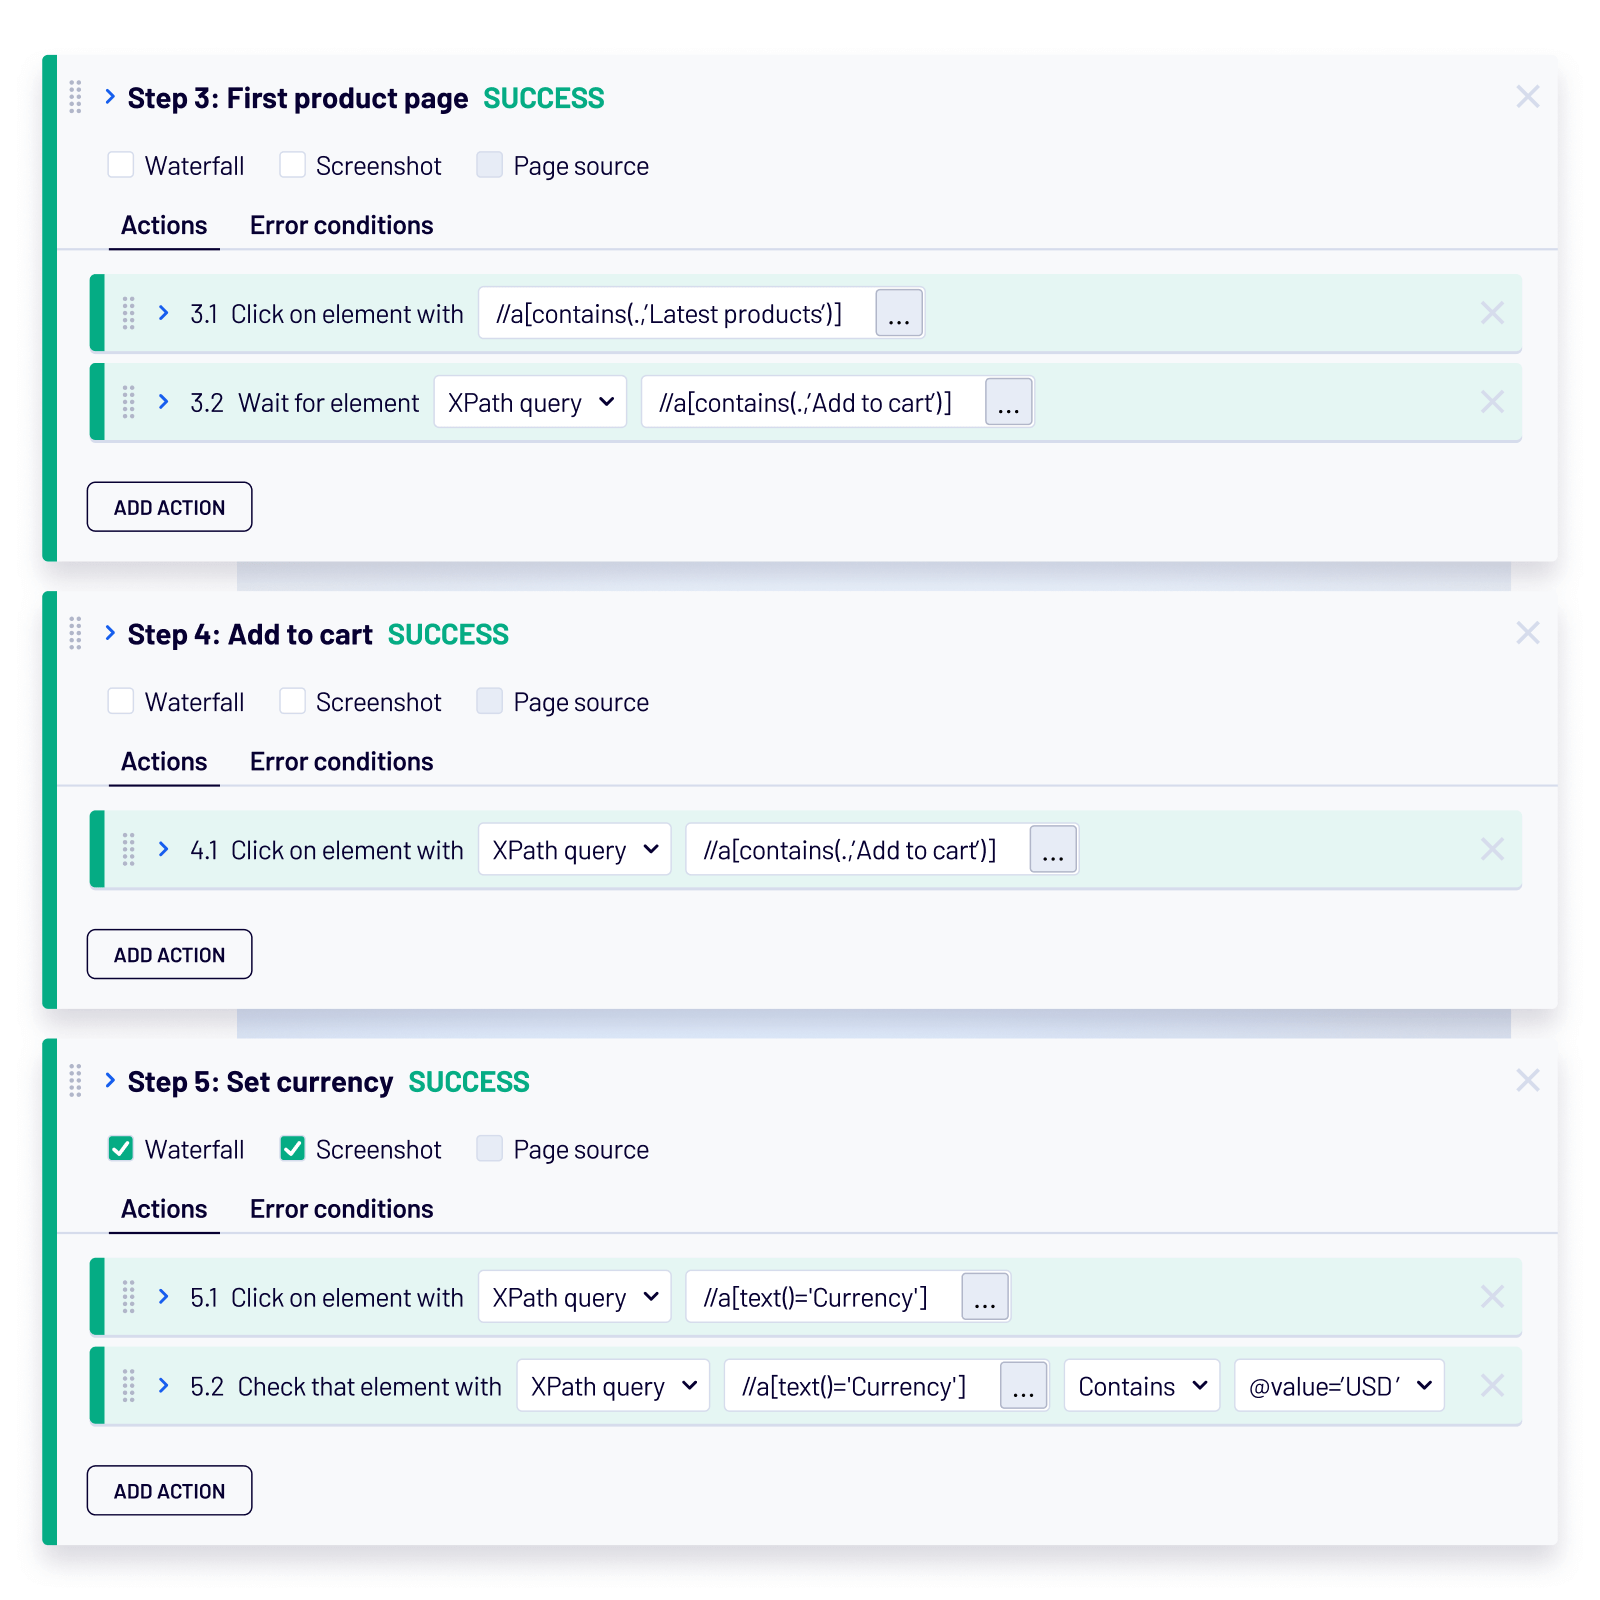
- Run real-world, in-browser tests: Simulate accurate user and API workflows.
- Preempt user friction: Detect slowdowns and failures before they escalate.
- Isolate issues fast: Capture errors using screenshots and filmstrips.
…with backend root causes
Actionable insights and deep analysis of underlying services.
- Set realistic thresholds: Automatically define SLOs using historical data.
- Pinpoint root causes: Correlate frontend errors with backend systems.
- Accelerate recovery: Drive informed action with real-time insights.
ITRS recognized in the 2025 Gartner® Magic Quadrant™ for Observability Platforms

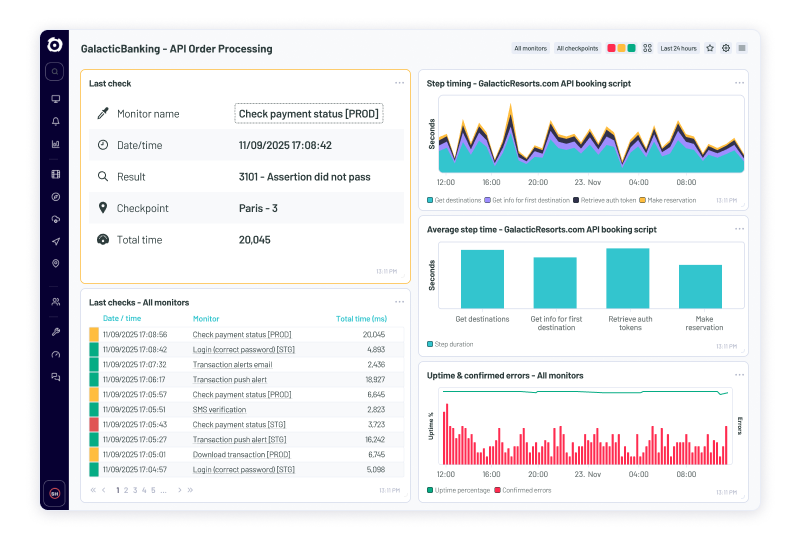
Catch issues early
Get advance warning of critical service disruptions
- Cut through the noise: Filter out false alarms and focus on what matters with smart alerts informed by machine learning.
- Spot true anomalies faster: Generate alerts only when synthetic performance significantly deviates from normal patterns.
- Align alerts with business expectations: Apply service-level objectives (SLOs) to transactions using historical data.
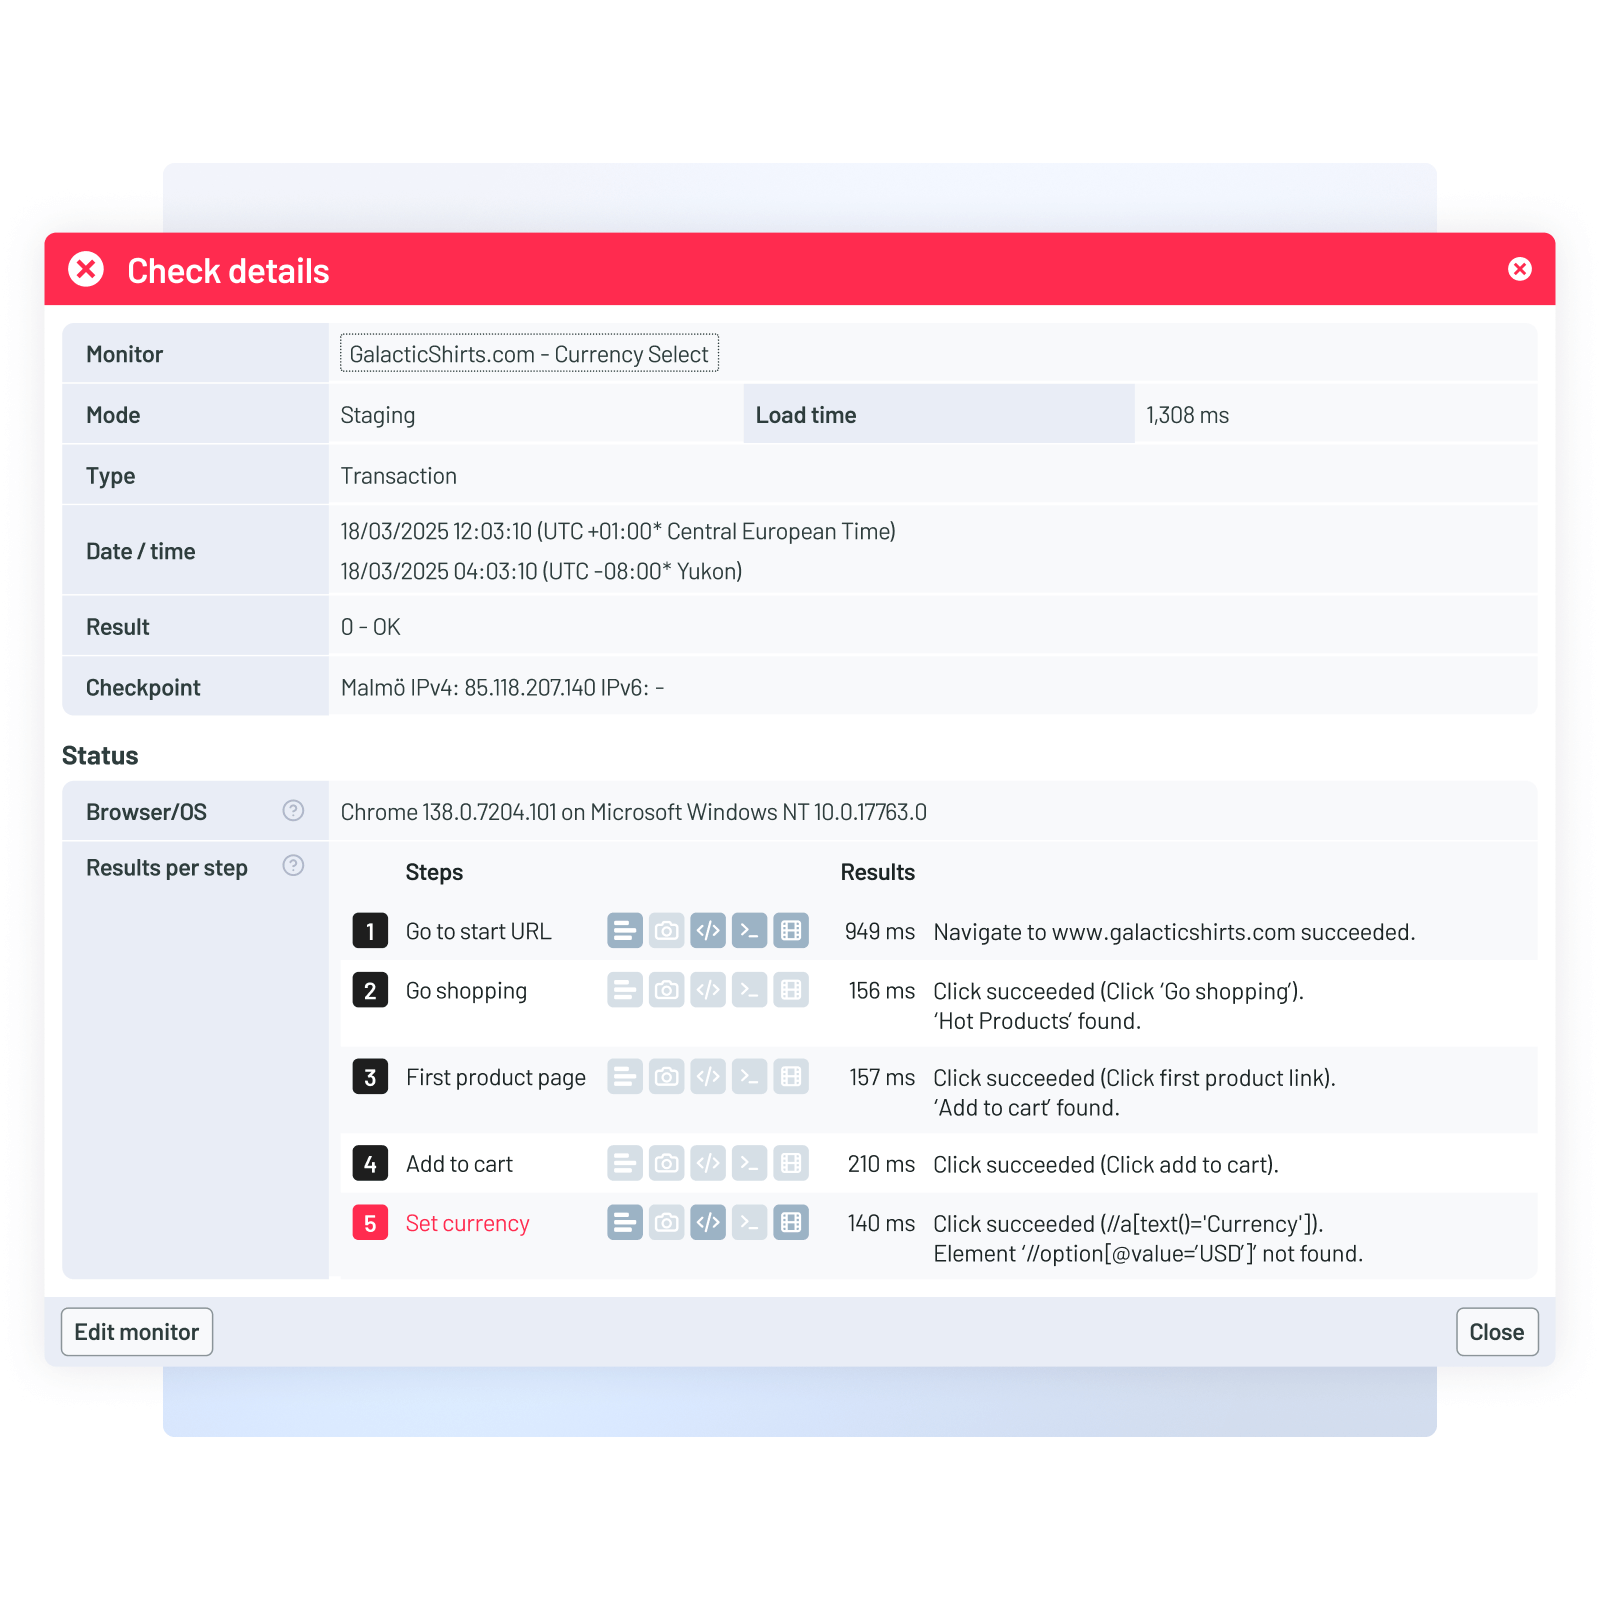
See real-world impact
Understand where user journeys break
- Rapidly isolate the affected service: View a clear, step-by-step breakdown of the entire transaction flow to pinpoint failures.
- Understand user impact: See the user’s perspective through screenshots and filmstrips captured during sessions.
- Confirm severity: Run tests from multiple global checkpoints to separate service issues from ISP or network glitches.
Create your first monitor in minutes
No coding required (unless you like to customize). No credit card needed.
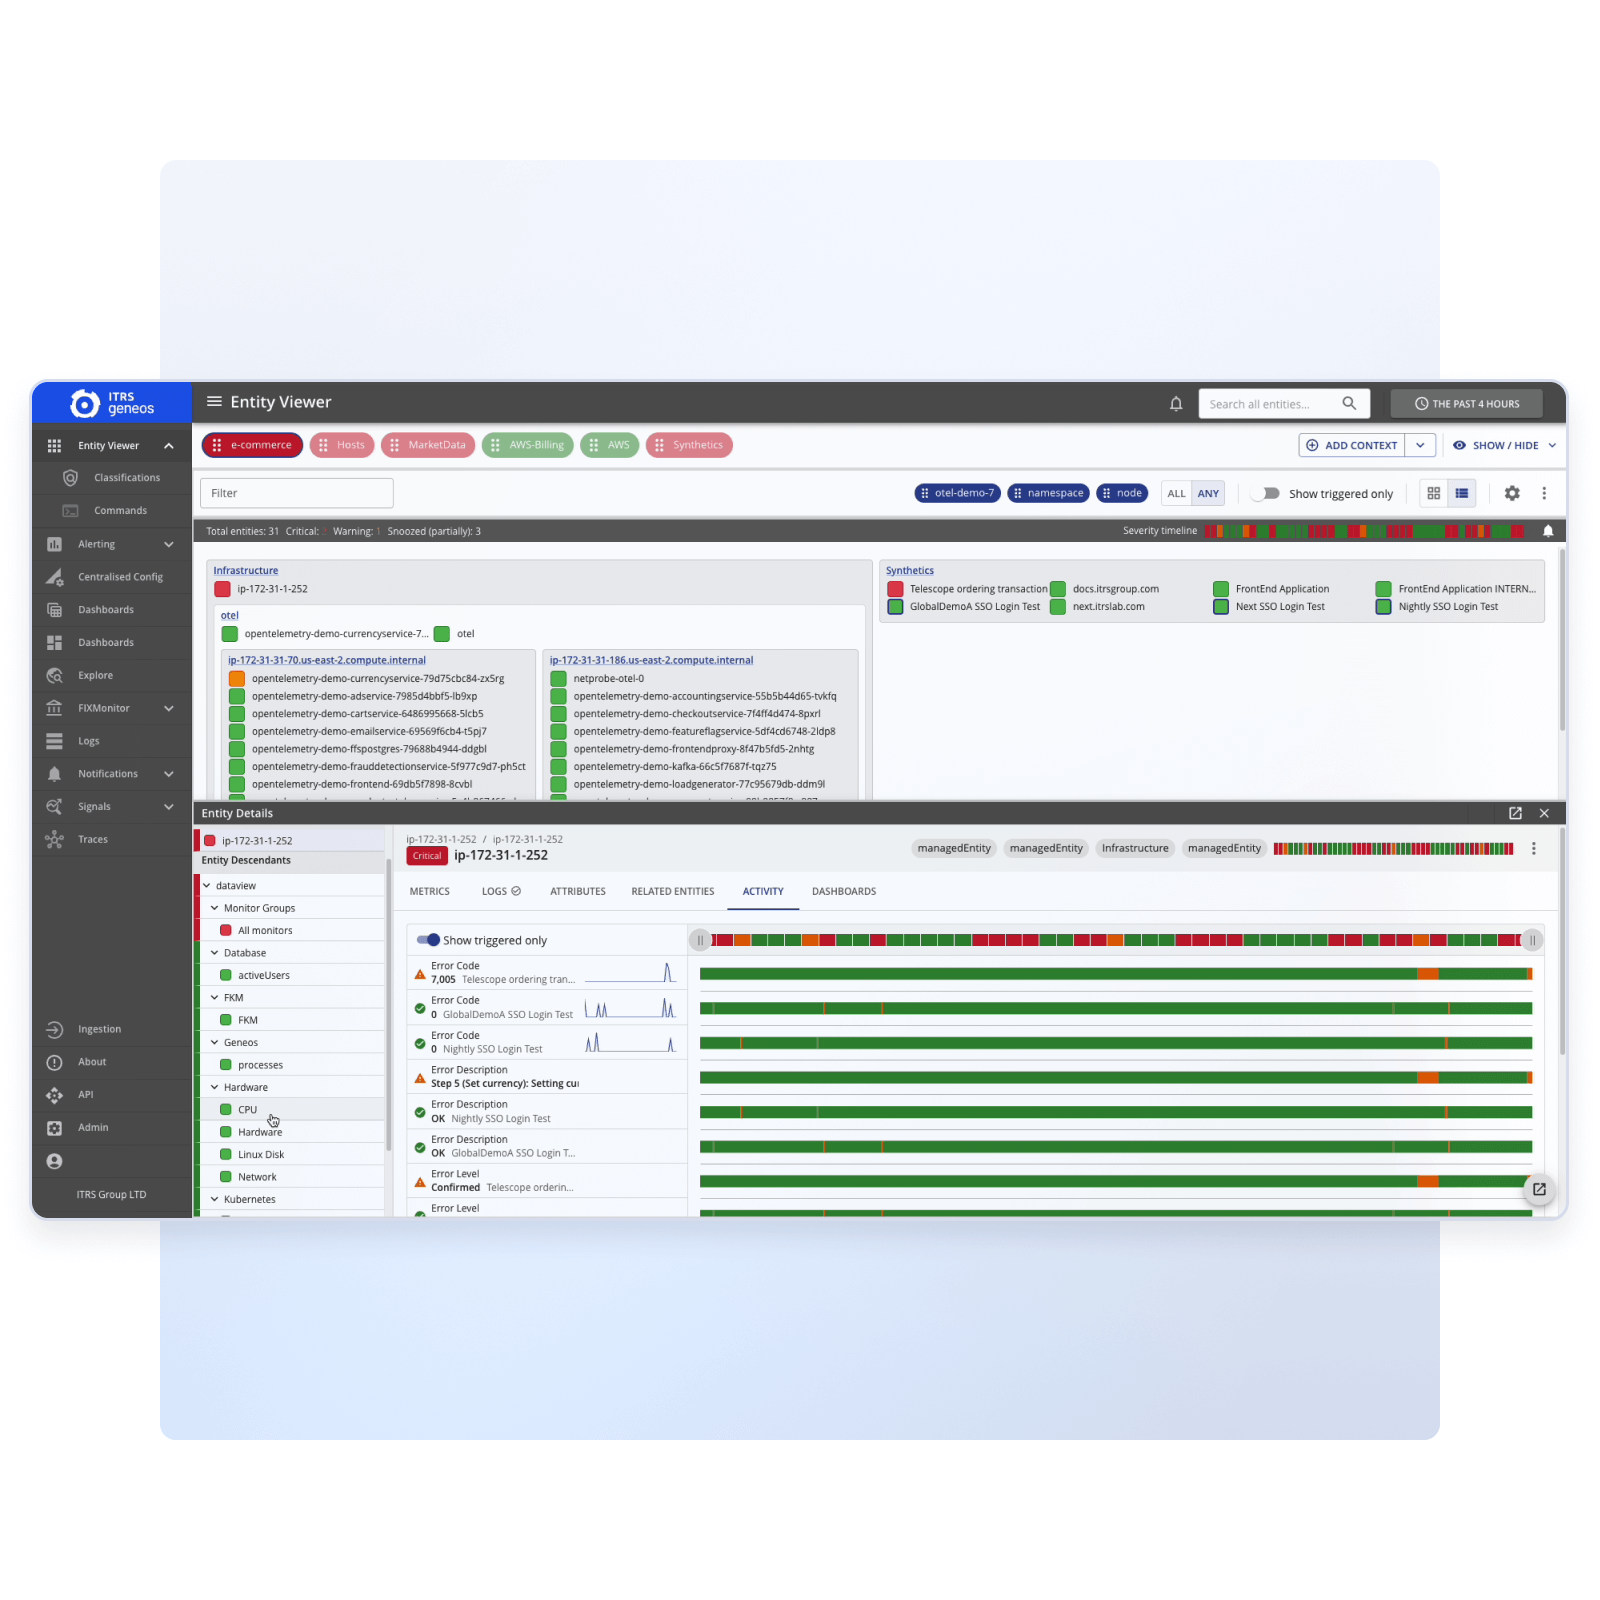
Triage backend issues
Conduct service-level troubleshooting
- Correlate frontend and backend: Link failed synthetic transactions to backend issues like non-responsive services.
- Drive informed remediation: Take action using contextual insights to execute restarts or escalate to the right teams.
- Enable root cause analysis: Retain historical data on backend activity to conduct root cause analysis following recovery.
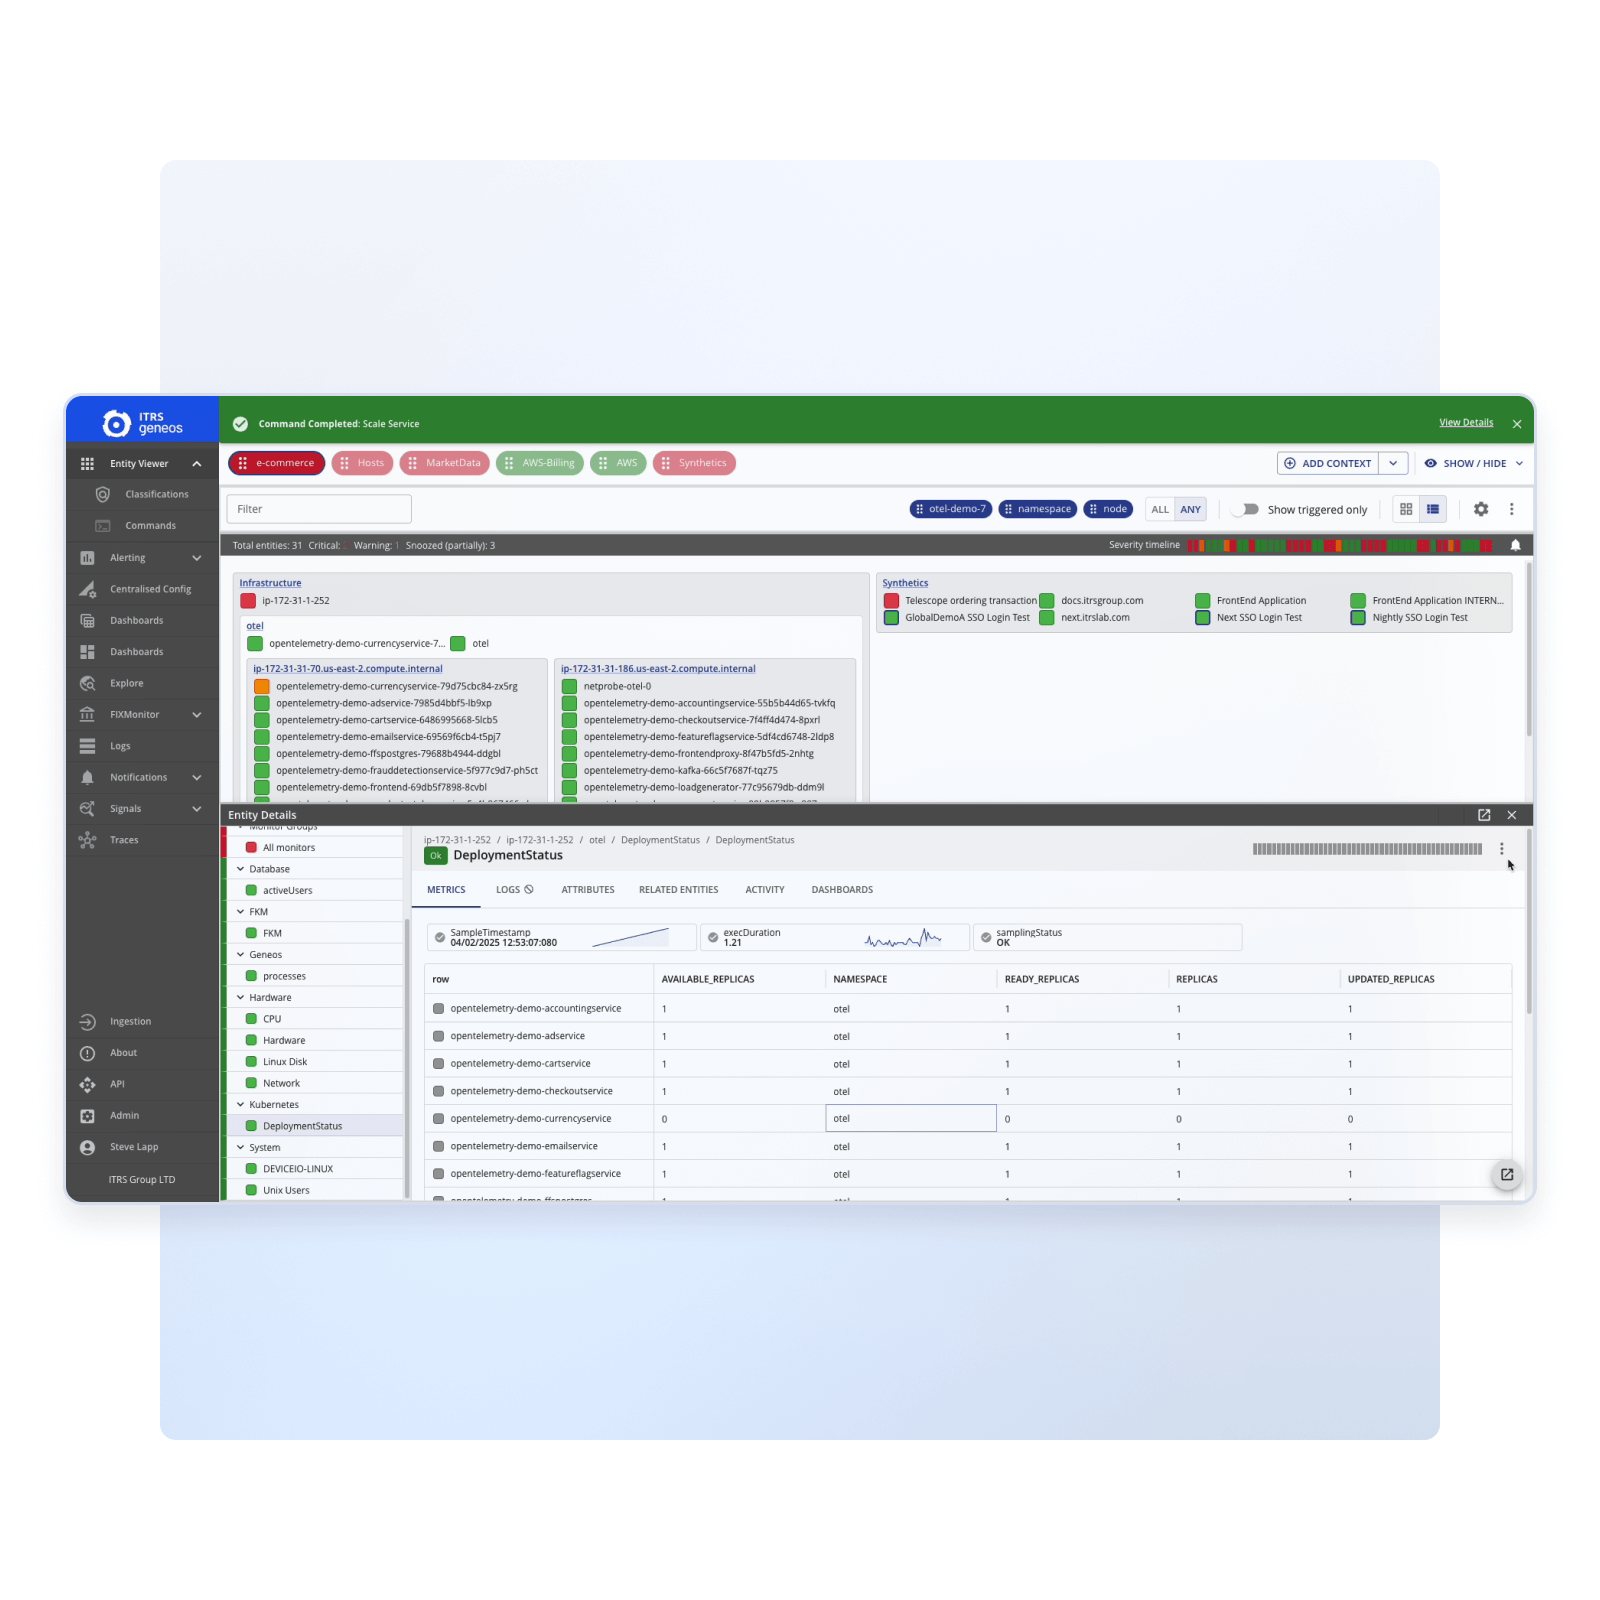
Verify fixes
Confirm remediation is successful
- Re-run synthetic checks: Test the full transaction flow from global checkpoints to ensure consistent performance.
- Validate fixes in real time: Instantly view results of each transaction step to confirm stability and responsiveness.
- Compare visual results: Review updated screenshots and filmstrips to verify expected behavior.
Free 30-day trial
Try Uptrends free today
Start monitoring your web services and get 30 days of free access to all our product capabilities. No credit card required.

Frequently Asked Questions
If you'd like a closer look or personalized guidance, we'll be happy to show you how Uptrends observability can be tailored for your specific use cases.
Book my 1-on-1 demoObservability in Digital Experience Monitoring (DEM) goes beyond traditional monitoring by turning complex, distributed data into real-time, actionable insights. It helps teams preempt issues, respond well in advance of user disruption, and improve overall service reliability.
Uptrends runs browser-based tests from physical locations in 233 cities worldwide across a wide range of networks and ISPs, simulating real user conditions. Gain insights you can trust when troubleshooting issues.
Synthetic checks and distributed tracing reveal where and why a transaction failed, from the UI down to backend systems. Historical data is retained, enabling both fast triage and effective root cause analysis after recovery.
The platform retains visibility into terminated containers and backend states, making it ideal for dynamic environments where services scale and shift rapidly. You don’t lose context just because infrastructure is transient.
Uptrends retains individual measurements for 90 days and aggregated performance data for two years, so you can see short-term detail and long-term trends.