
This article covers the core components of Uptrends monitoring. You will learn how monitors work, what they check, and how alerts notify you when issues occur.
Key capabilities
Uptrends helps you track the availability and performance of your websites, web applications, and APIs in two main ways:
- Synthetic monitoring — uses configurable monitors running from global or internal checkpoints to proactively detect errors or downtime
- Real User Monitoring (RUM) — tracks the experience of actual users. When issues are detected, Uptrends triggers alerts that can be delivered using default, custom, or third-party integrations, helping teams respond quickly and minimize impact.
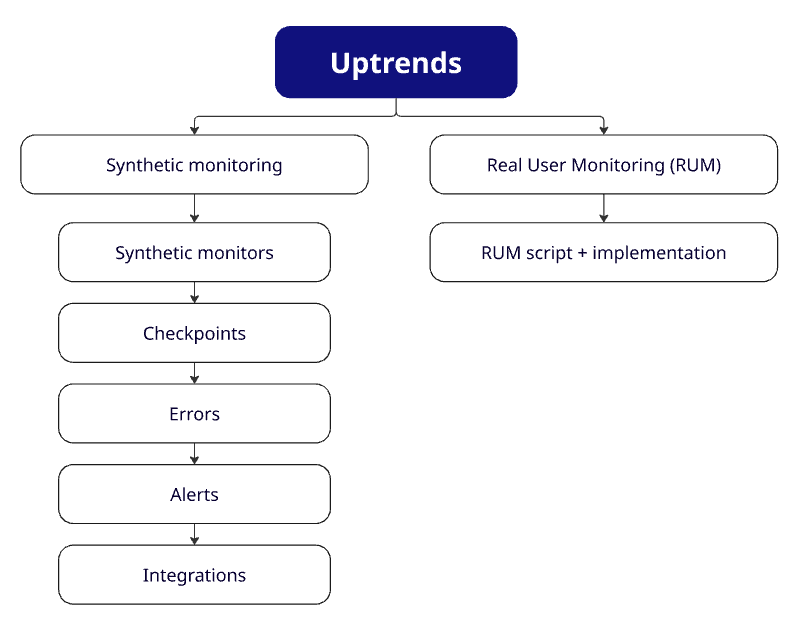
Synthetic monitoring
How synthetic monitors work
Synthetic monitoring is a type of monitoring that uses automated processes to visit websites or make service requests, checking responses to track uptime and behavior.
In Synthetic monitoring, monitors are the foundation of the monitoring system. Monitors run checks from multiple locations around the world to verify that your website is working as expected. These checks simulate real user interactions, such as navigating to pages, clicking buttons, calling APIs, and more.
Think of monitors as a digital watchdog that never sleeps. They continuously check your websites and services, test user flows, validate APIs, and collect performance data, giving you a complete picture of your system’s reliability and performance.
These monitors track your websites from an end-user perspective using external monitoring. Monitors run checks through global checkpoint servers located in different parts of the world to measure your websites and web services' behavior without location or network latency bias.
Uptrends is not only limited to monitoring external web applications and services. You can also monitor your internal environment using private locations. Private locations extend monitoring capabilities inside your own network, allowing you to run checks from inside your network (behind your firewall). This approach maintains full control over internal systems that public checkpoints cannot reach.
With this approach, Uptrends continuously checks your websites and web services around the clock. Instead of waiting for real users to encounter problems, synthetic monitoring proactively checks reliability, performance, and functionality.
Synthetic monitor types
Uptrends offers the following synthetic monitor types:
- Uptime monitors — perform basic checks such as checking the website’s availability, page content, and load time. You can choose from HTTPS, DNS, Ping, SSL, Database, and Mail server monitors.
- Browser monitors (Full Page Check (FPC)) — perform detailed performance checks on your web page on an element-by-element basis.
- API monitors — examine the responses returned by API endpoints and verifies that they contain the expected content.
- Transaction monitors — validate user journeys to confirm that application behavior aligns with user expectations.
For more information, see Synthetic monitoring article.
Real User Monitoring (RUM)
Uptrends also offers Real User Monitoring (RUM), which collects performance data from actual visitors to your website. When someone opens your site, RUM measures load times, key performance timings, and errors that occur. Since every visitor uses different devices, browsers, and internet connections, RUM captures these variations to show you how your website performs in real-world conditions.
RUM complements synthetic monitoring by showing you how actual users experience your website, including which browsers, operating systems, and device types they use.
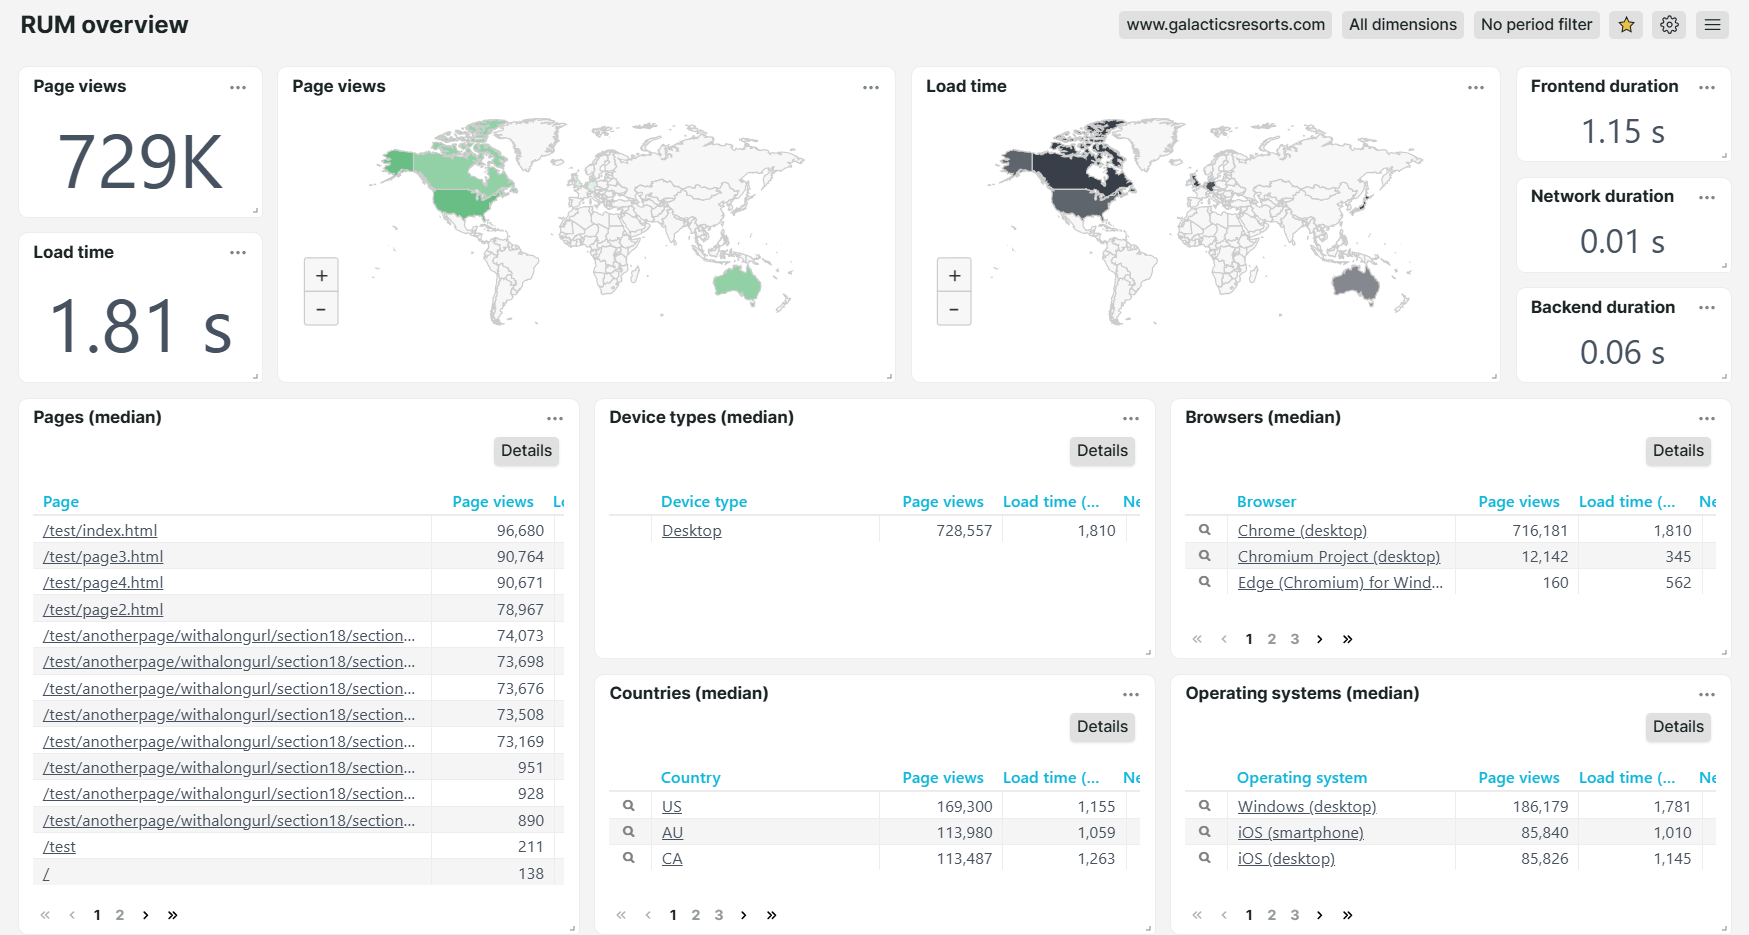
For more information, see Real User Monitoring (RUM).
Monitor checks and results
Depending on the monitor type and how you set it up, each check collects data and shows you the results. These results help you see whether your website or web services are performing well.
Uptrends displays vital measurements of your website, such as load time, total bytes, download time, connection time, and more. It also provides advanced checks, including Core Web Vitals, W3C Navigation timings, page source, and console logs. It can generate a filmstrip with a sequence of screenshots from the browser, showing what the page looked like at different points while loading. You also get a waterfall chart (a bar chart) that shows when each page element starts loading and how long it takes.
For more information, see Monitor results overview.
Dashboards and reporting
In addition to monitor results, Uptrends provides dashboards that help you visualize your monitoring data. Dashboards include charts, graphs, and tables so you can spot trends and understand what’s happening at a glance. You can export dashboards into reports in formats like PDF and Excel. You can also share data with your team, or schedule reports to be sent automatically to you and other users. If needed, you can publish a dashboard as a public status page.
For more information, refer to Dashboards and reports.
Alerts and integrations
When a monitor detects an issue, for example, slow load times or 404 errors, Uptrends can alert you right away. You can set when alerts should be generated and what messages should be sent. You can use default channels, such as email and SMS, or third-party integrations such as Slack and Microsoft Teams.
If you need more flexibility, you can build a custom integration to send Uptrends alerts to other platforms and fit your existing workflow.
For more information, see Alerting overview.