
This article gives an overview of how to export your existing Uptrends monitoring data to OpenTelemetry-supported platforms. If you are new to the concept of OpenTelemetry, we recommend reading the OpenTelemetry documentation.
Overview
Uptrends supports exporting monitoring data to observability platforms using the OpenTelemetry (OTel) standard.
The Uptrends OpenTelemetry export allows you to correlate Uptrends Digital Experience Monitoring (DEM) data with application, infrastructure, and log data in platforms such as Elastic, New Relic, Splunk, Prometheus, or ITRS Analytics.
With Uptrends OpenTelemetry export, you can:
- Integrate Uptrends into your observability stack for centralized analysis of synthetic monitoring data alongside application and infrastructure telemetry.
- Identify root causes and correlate applications, web servers, databases, and other services in a single observability platform.
- Eliminate manual comparisons of logs, metrics, and traces across platforms.
Characteristics of the Uptrends OpenTelemetry export
The Uptrends OpenTelemetry export acts as a bridge between the Uptrends platform and your observability backend. It sends Uptrends monitoring results to an OpenTelemetry collector, where the data can be processed and forwarded to one or more observability platforms.
Components
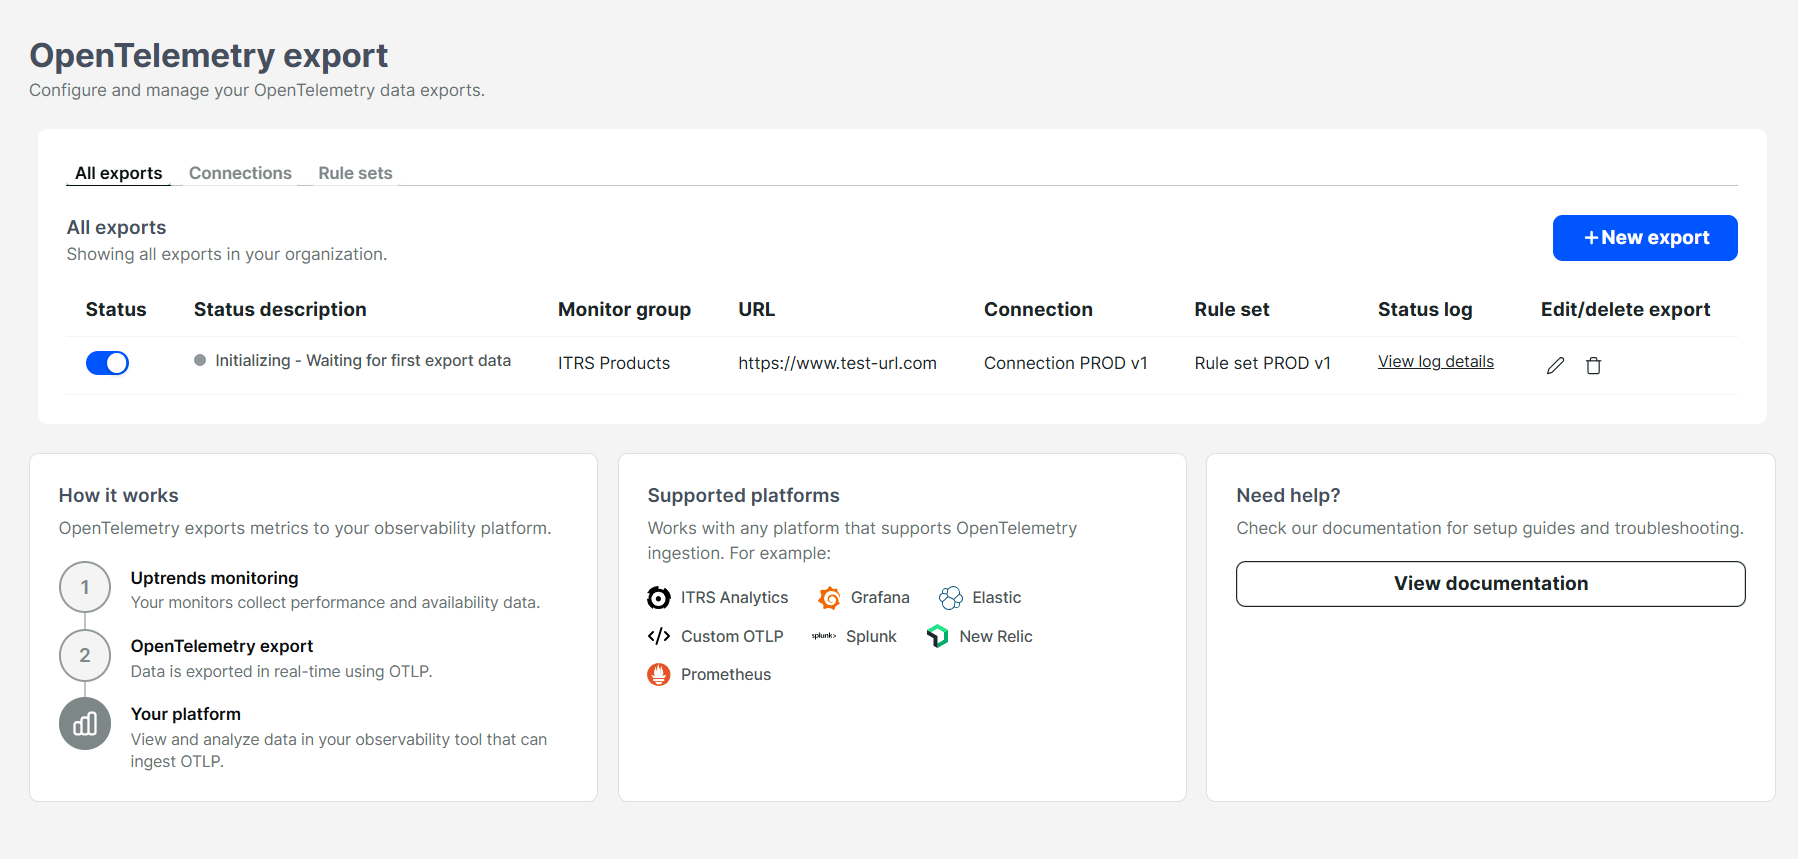
Each export combines a connection, a rule set, and a monitor group. You can create as many of these combinations as you need:
- Connection — defines the OpenTelemetry endpoint URL and the authentication Uptrends uses to deliver data to your connector.
- Rule set — defines service identifiers and custom attributes that determine how exported data is identified in your observability platform. You may create multiple rule sets to scope data differently (for example by namespace, service name, or instance ID).
- Monitor group — defines the monitor group to export metrics from.
Latency
Target delivery time is approximately 1 minute after monitoring data is collected. In most cases, data is exported within seconds, but delivery time can vary depending on factors such as collector availability, network conditions, and processing load. There is currently no SLA for export latency.
Retry behavior
When your connector is unavailable or inaccessible, Uptrends retries delivery on a schedule of 1 minute, 5 minutes, 30 minutes, and 1 hour, for up to 6 days from the first failed attempt. Any data that remains undelivered after that is permanently dropped.
Your observability platform may also reject late-arriving data if it is older than its configured retention threshold.
Delivery model
After successful delivery, Uptrends removes the data from the export queue and does not resend it.
Multiple export targets
You can configure multiple combinations of OpenTelemetry connections, rule sets, and monitor groups, and connect each combination to multiple targets. There is no limit to the number of targets.
Examples:
- Monitor group A → Target A
- Monitor group B → Target B
- Monitor group A → Target A and Target B
This lets you export to multiple platforms or multiple tenancies within the same platform.
Setup and configuration
To get started with the Uptrends OpenTelemetry export: