
This article explains how to navigate the Uptrends web application depending on which interface you are in: classic or modern.
Classic web application interface
The classic interface offers full access to Uptrends' monitoring, reporting, and configuration capabilities with a detailed menu that displays all options and settings upfront.
When you create monitors, the Monitor Editor shows a tabbed interface, where all configuration options are organized into categories. You can configure everything from basic settings to advanced options, such as what the monitor checks, how often it runs, and which checkpoints it uses.
The classic interface looks like this:
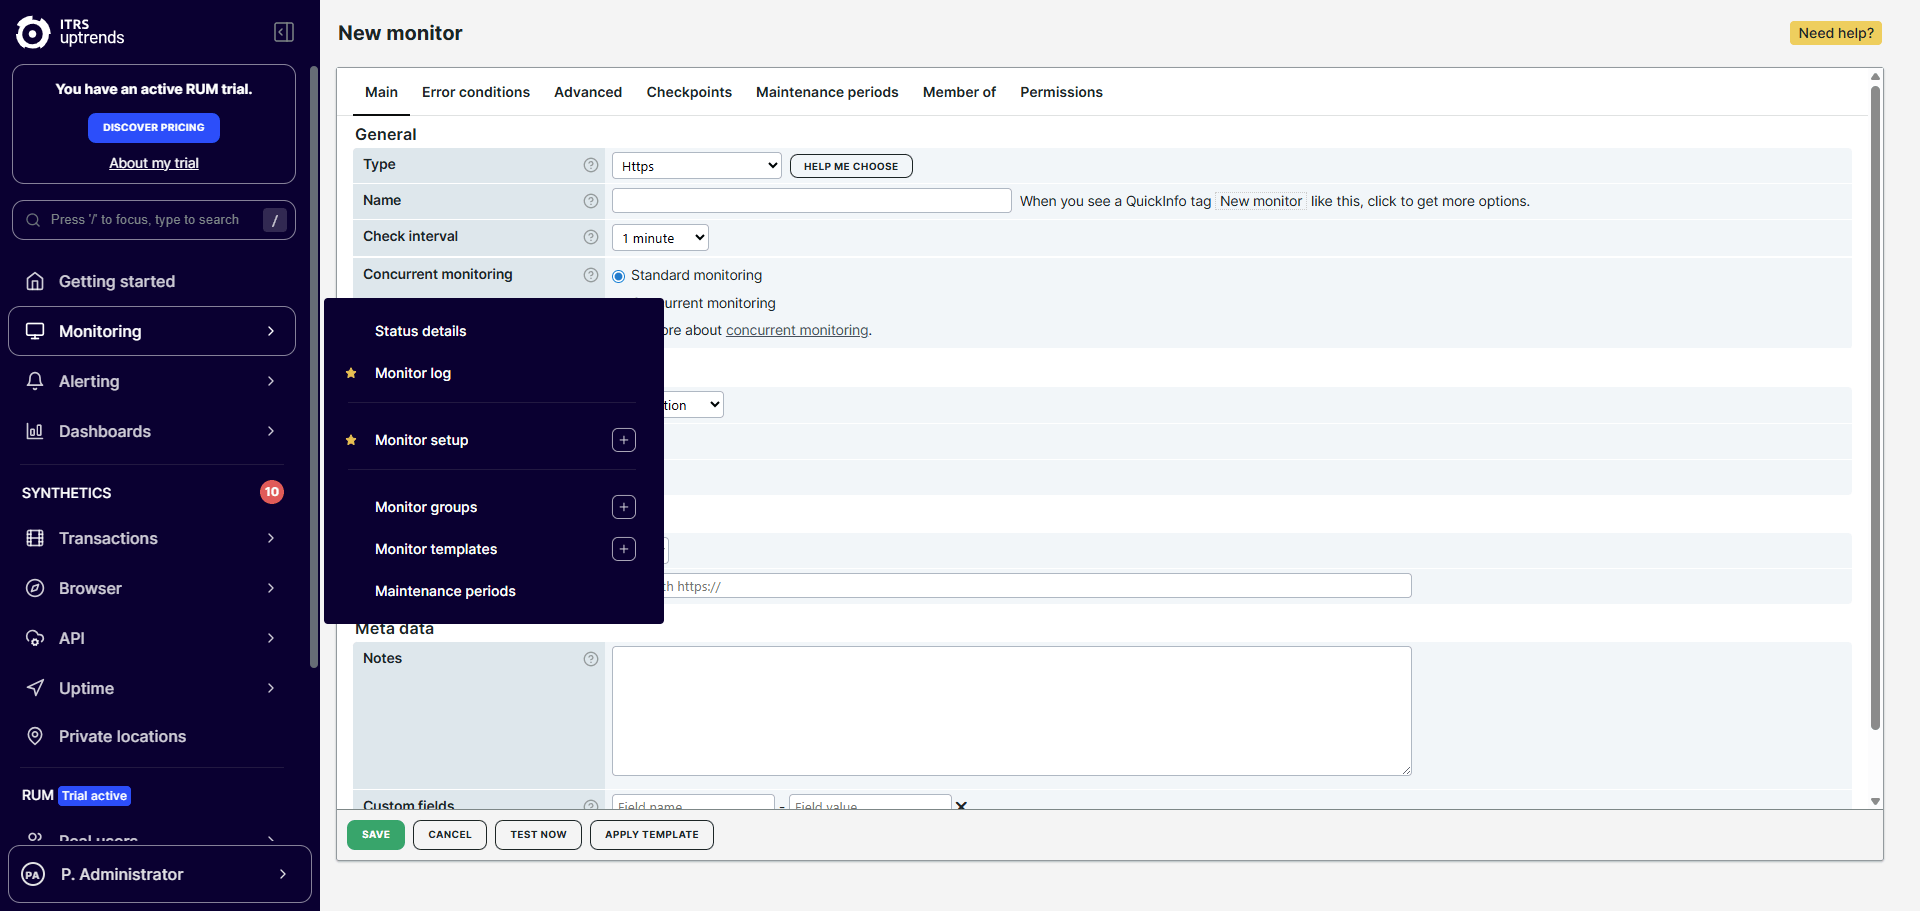
Navigating the menu
The menu includes the following submenus. Depending on your subscription, some items may not be available.
| Menu item | Submenus |
|---|---|
| Getting started | See overall monitoring health at a glance, check monitor statuses and account health to identify issues or bottlenecks. |
| Monitoring | Check the status of your monitors, review logs, and manage your monitoring setup. Use this menu to create or edit monitors, organize them into groups, apply templates, and schedule maintenance periods. |
| Alerting | Stay on top of issues. View current alerts, browse alert history, and configure how and when Uptrends notifies you, including setting up integrations with tools like Slack or email. |
| Dashboards | Build and view dashboards to visualize your monitoring data for analysis and reporting. Use predefined dashboards or customize your own, the way that works for your team. |
| Synthetics | Manage and configure monitors to track the behavior of your websites, APIs, and other web services. Uptrends offers transaction, uptime, browser (full-page checks), and API monitoring. |
| Real User Monitoring | See how real users experience your website, including page load times and errors captured from actual browser sessions. |
| Account setup | Manage everything behind the scenes: operators, scheduled reports, public status pages, SLA definitions, vault secrets, and billing. You can also monitor your internal network and systems using private locations. |
| Tools & apps | Access diagnostic tools, download the Uptrends mobile application, get the Transaction Recorder for transaction monitors, or set up infrastructure-as-code with Terraform. |
| Support | Get help when you need it. Submit a support ticket, view how to guides in the Knowledge Base, chat with the support team, or suggest a feature. |
| Profile | Update your personal settings, change your password, or log off. |
Walkthrough
Click Start the tour to explore the Uptrends classic web application interface.
Modern web application interface
The modern interface simplifies Uptrends with streamlined navigation for configuring monitors, detecting issues, and analyzing performance.
When you create monitors, the Monitor Editor includes a simplified view that guides you step by step, with an optional advanced mode for more control.
The modern interface looks like this:
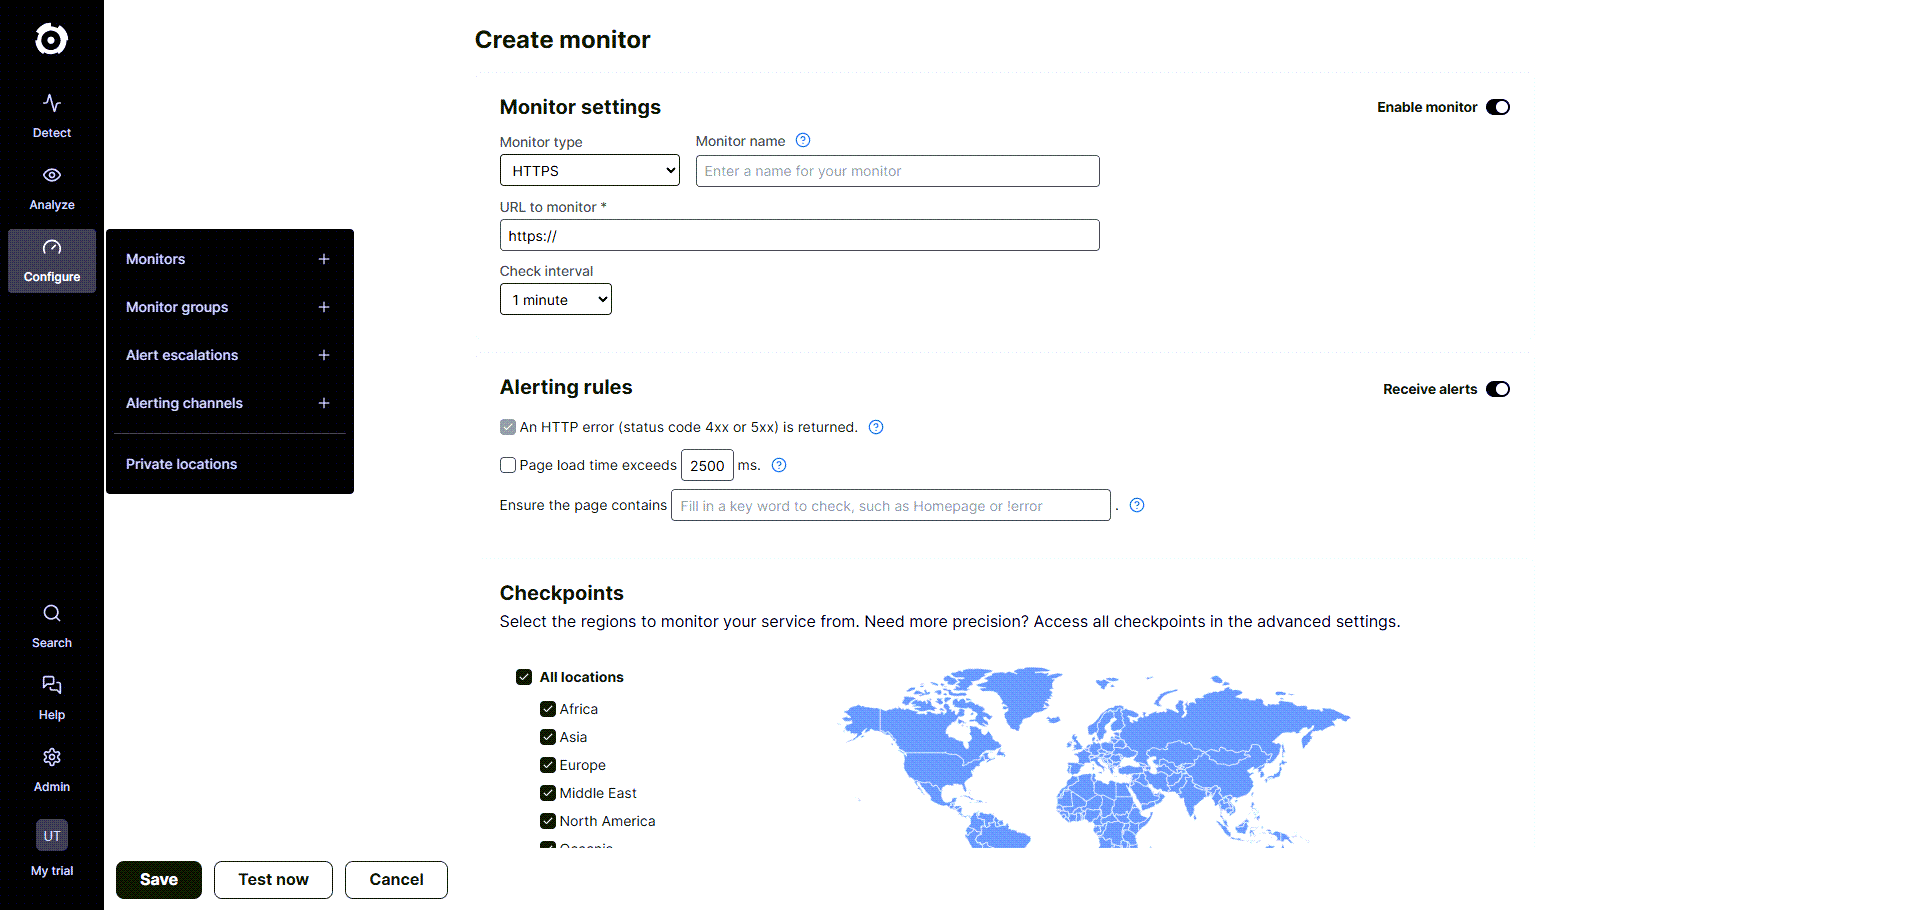
Navigating the menu
The menu includes the following submenus. Depending on your subscription, some items may not be available.
| Menu item | Submenus |
|---|---|
| Detect | See overall monitoring health at a glance, check monitor statuses and account health to identify issues or bottlenecks. |
| Analyze | Assess and explore monitoring data. View monitor insights, review alert history, track SLA compliance, and browse detailed monitor logs and dashboards. |
| Configure | Set up and manage your monitors and alerts:
|
| Help | Get help when you need it. Submit a support ticket,view how to guides in the Knowledge Base, chat with the support team, or see what’s new in Uptrends. |
| Admin | Manage everything behind the scenes: operators, scheduled reports, public status pages, SLA definitions, vault secrets, and billing. Monitor internal network or systems using private locations. |
| Settings | Update your personal settings, change your password, or log off. |
Walkthrough
Click Start the tour to explore the Uptrends modern web application interface.
Get started with monitoring
Now that you’re familiar with the Uptrends web application, you are ready to start using the application. To get started, follow the steps in the Quickstart guide.