Uptrends web application interface
The Uptrends web application provides a unified platform to monitor your websites, APIs, and other services. This is where you:
- Set up and configure monitors.
- View monitor check results, logs, and key metrics.
- Analyze uptime, performance, and errors using dashboards and other reporting views.
- Define alerting and integrations so your team is notified when issues occur.
- Manage roles, permissions, subscription and other account-level settings.
Uptrends is rolling out UI enhancements, you may see any of the two user interfaces: classic and modern. Both give you access to the full monitoring, reporting, and configuration of Uptrends capabilities, though the navigation and some layout differ.
This article provides a foundation for understanding the Uptrends web application interface. For interface-specific workflows and navigation, see the Classic and modern interfaces article.
Layout
The UI is designed with a two-panel layout that provides a clear, data-focused workspace for monitoring your web services:
Menu
A left-side navigation panel that gives you access to Uptrends pages for monitoring, reporting, and configuration. Whether you need to create a monitor, check dashboard status, or configure user settings, it serves as your primary navigation hub. In a trial account, some menu items may not be available. You may also see options to start a trial for products you are not using yet.
Workspace
The main content area where your configurations and settings are displayed. This is where you view the core interface components such as dashboards, editors, and configuration overviews.
It consists of two main sections that balance easy navigation with detailed content display.
Search and help
Use the search bar to quickly find monitors, alerts, integrations, and settings within the Uptrends web application. The Help menu allows you to access resources from the Knowledge Base, submit support tickets, and view the latest updates from Uptrends.
Core interface components
Regardless of which interface you are using, the Uptrends web application includes these core components:
Dashboards
Dashboards are used to visually present your monitoring data in an organized way. They are made up of tiles that show data as lists or charts. You can filter, search, and analyze monitoring results to identify patterns, troubleshoot issues, and verify performance over time.
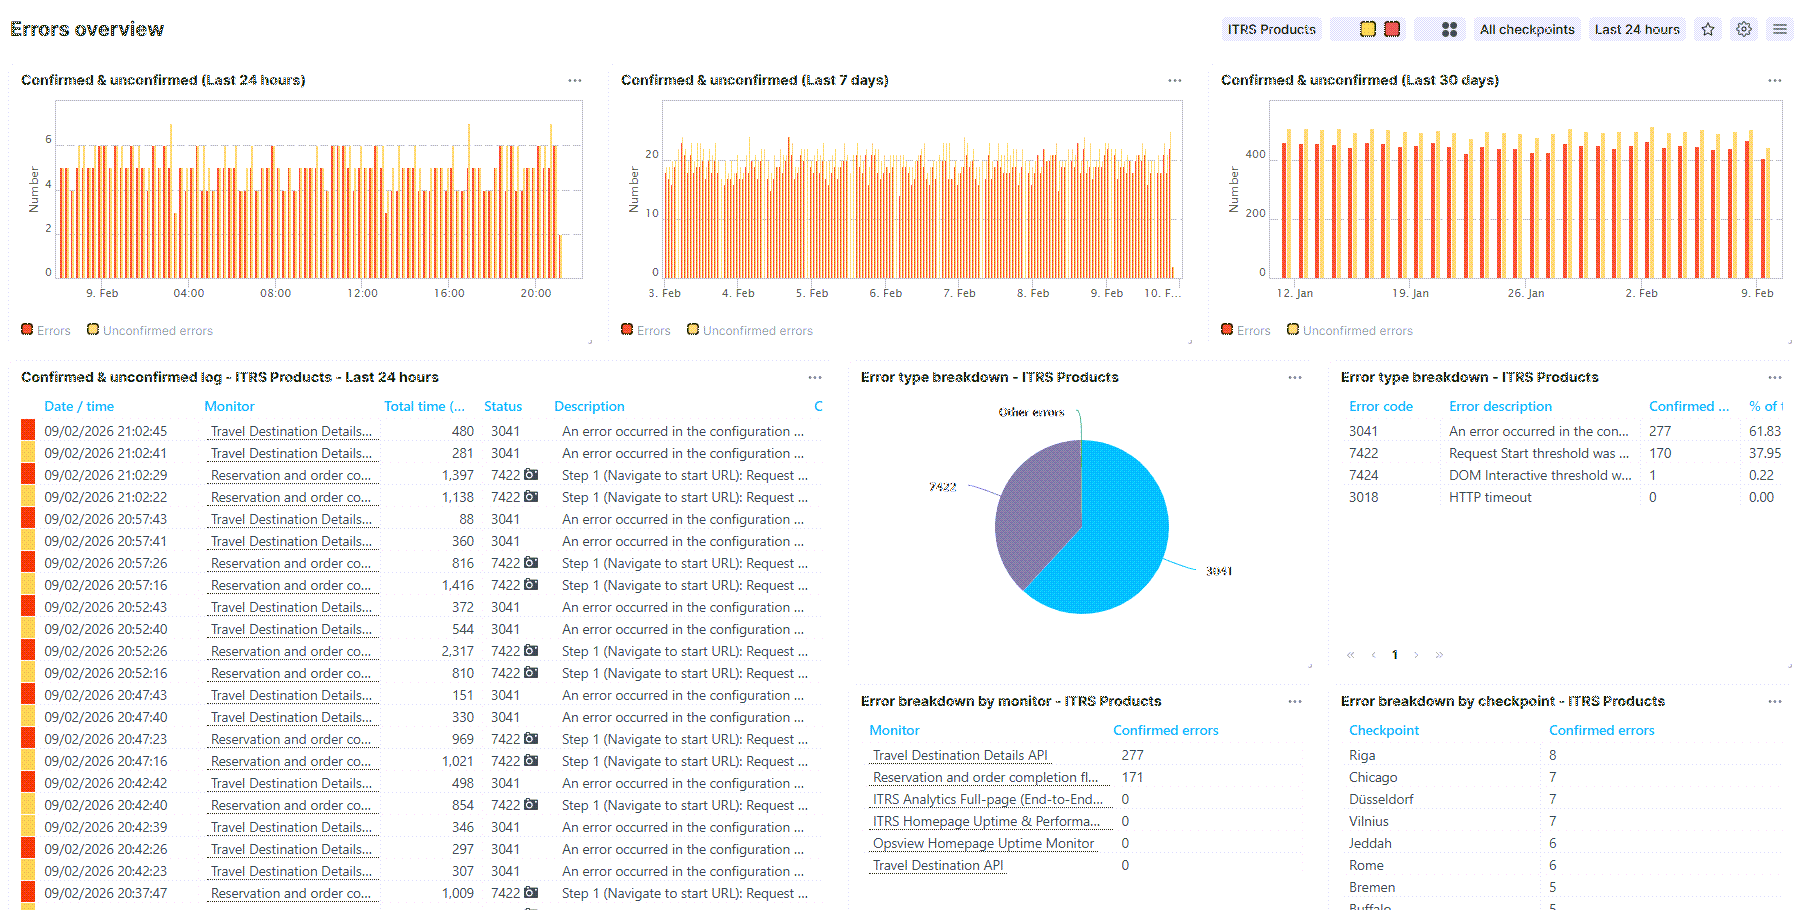
Uptrends has two types of dashboards: predefined and custom.
Predefined dashboards
Predefined dashboards are ready-made dashboards that show you an overview for a specific item. Examples include Errors overview, Uptime overview, Monitor log, and Alert history. When you create a monitor, it also comes with a default predefined dashboard.
All predefined dashboards are fixed and cannot be edited.
Custom dashboards
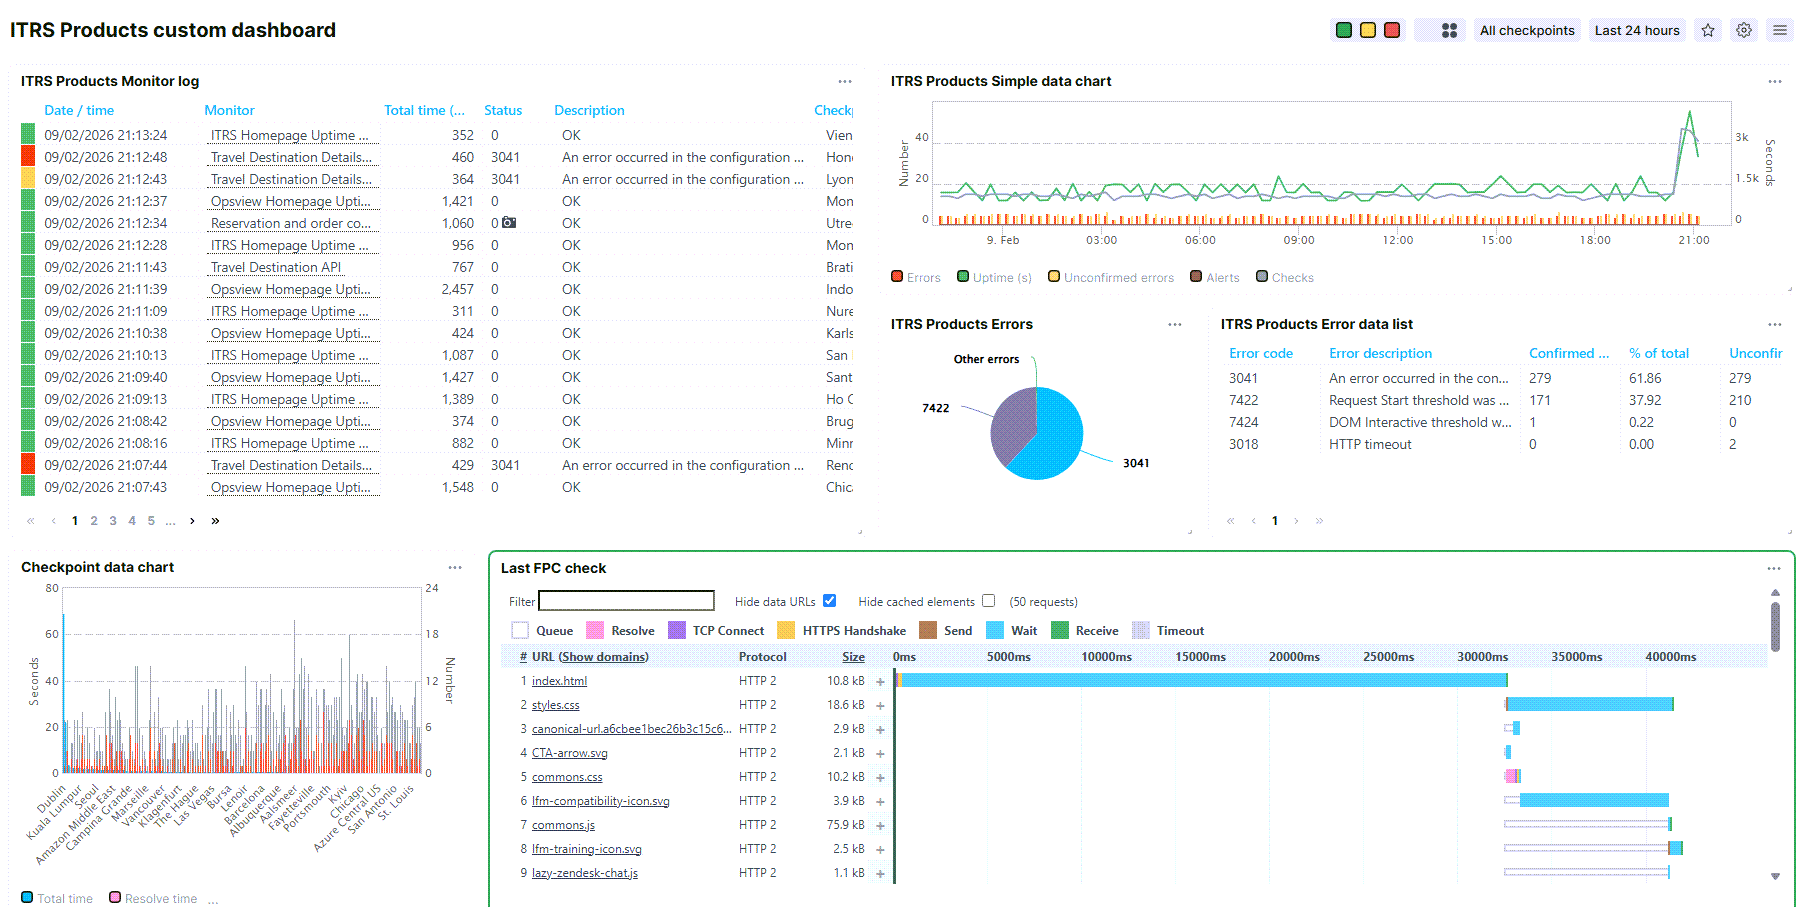
Custom dashboards let you create and personalize your own dashboards. You can add tiles like charts and tables to display data from one or more monitors in one place. Use them to build, organize, and visualize your data the way you want.
Configuration overviews
Configuration overviews show organized list of items, such as monitors, operators, and alerts. This gives you a high-level overview of information so you can quickly check their status without digging into details.
Examples of configuration overviews include:
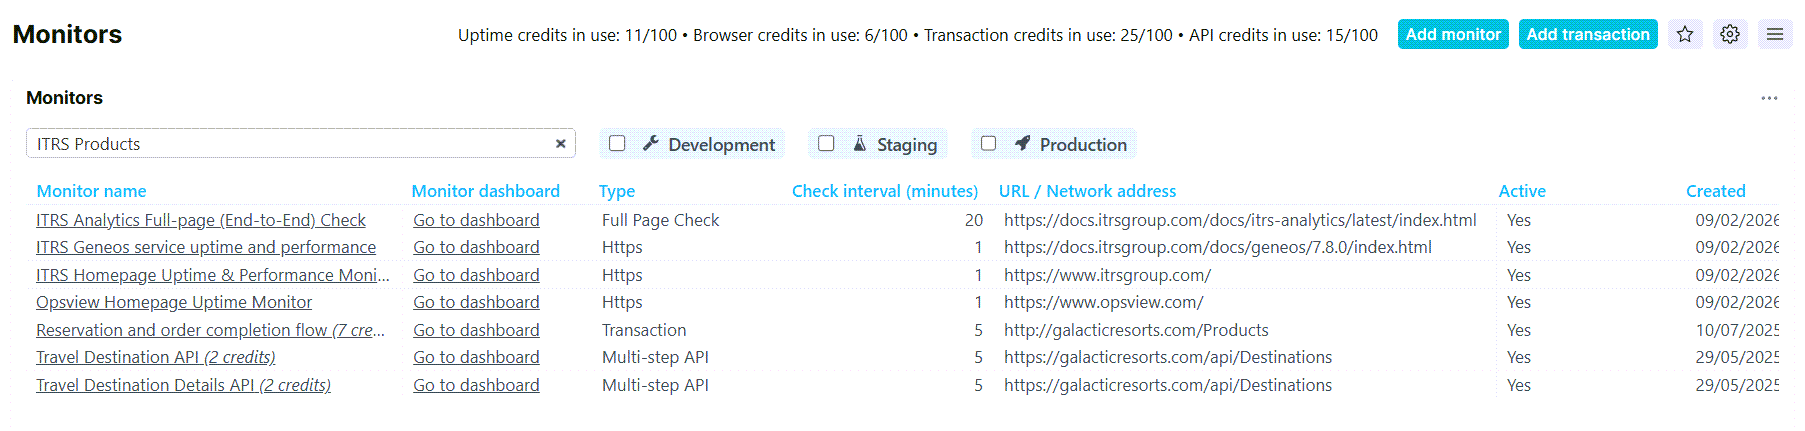
Monitor configuration overview
Lists all monitors, including monitor name, type, check interval, and URL.
Operator configuration overview
Lists all operators, including their name, email, login details, and status.

Editors
Editors let you create and modify items such as monitors, alerts, and dashboards. They give you the settings you need to customize for each item’s behavior.
Examples of editors include:
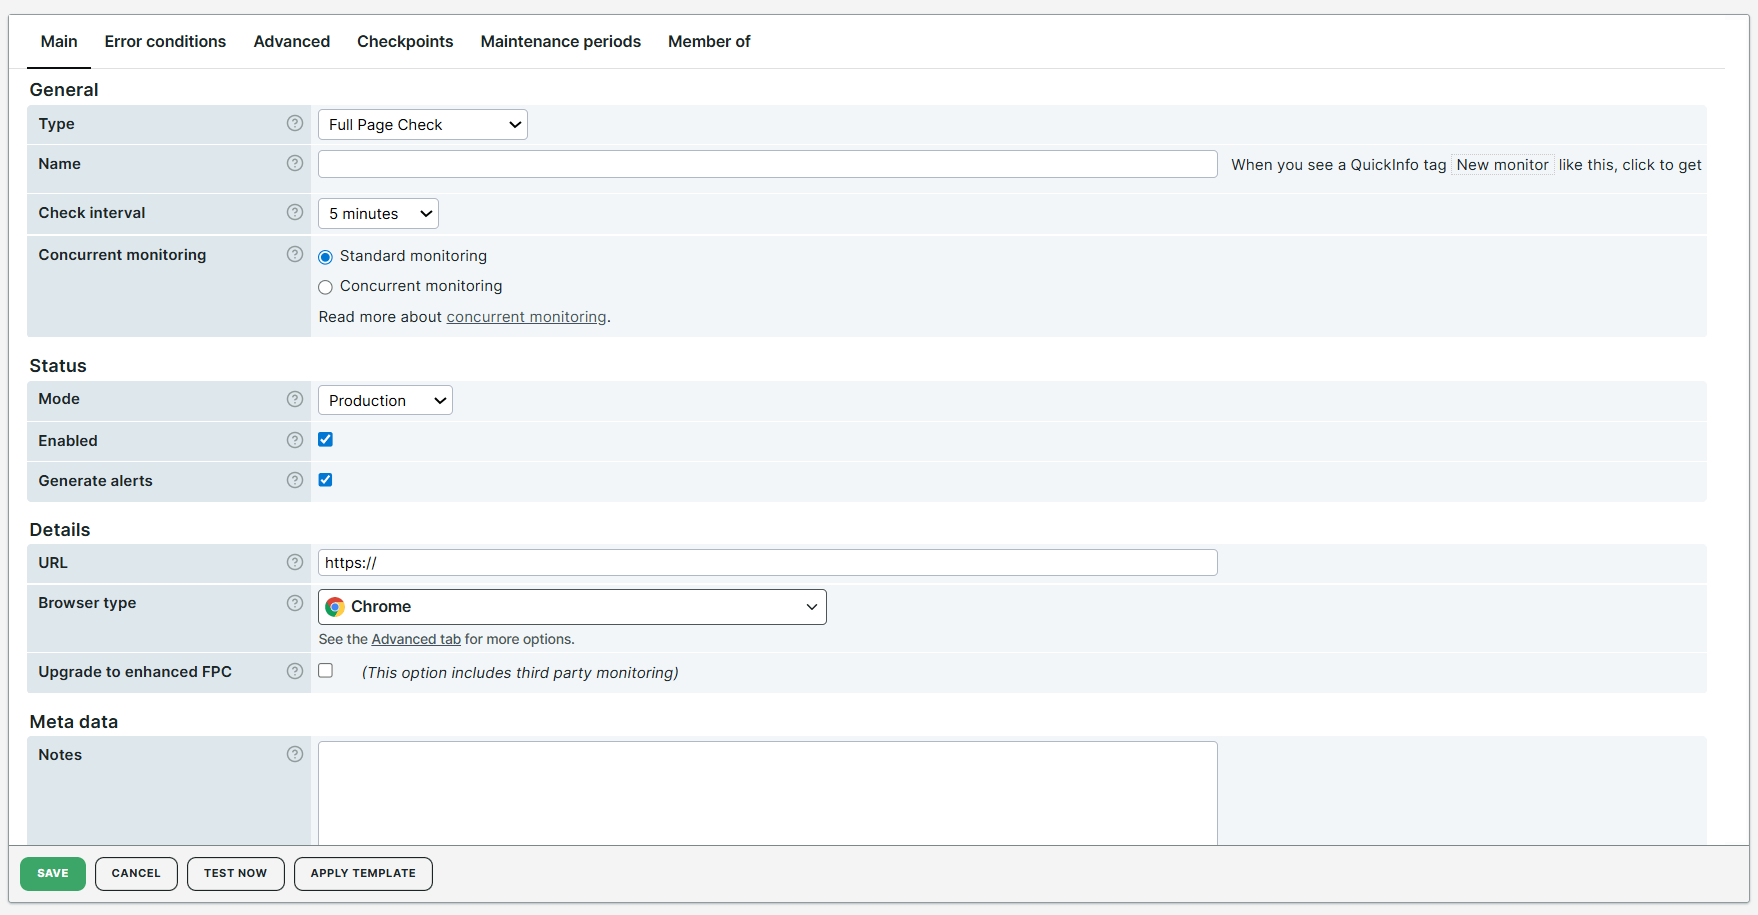
Monitor Editor
Gives you access to all monitor configuration. The Monitor Editor presents a tabbed interface that groups related settings into categories. Each tab focuses on a specific area, from basic settings to advanced options. This is where you configure what a monitor checks, where it runs from, and how it performs those checks.
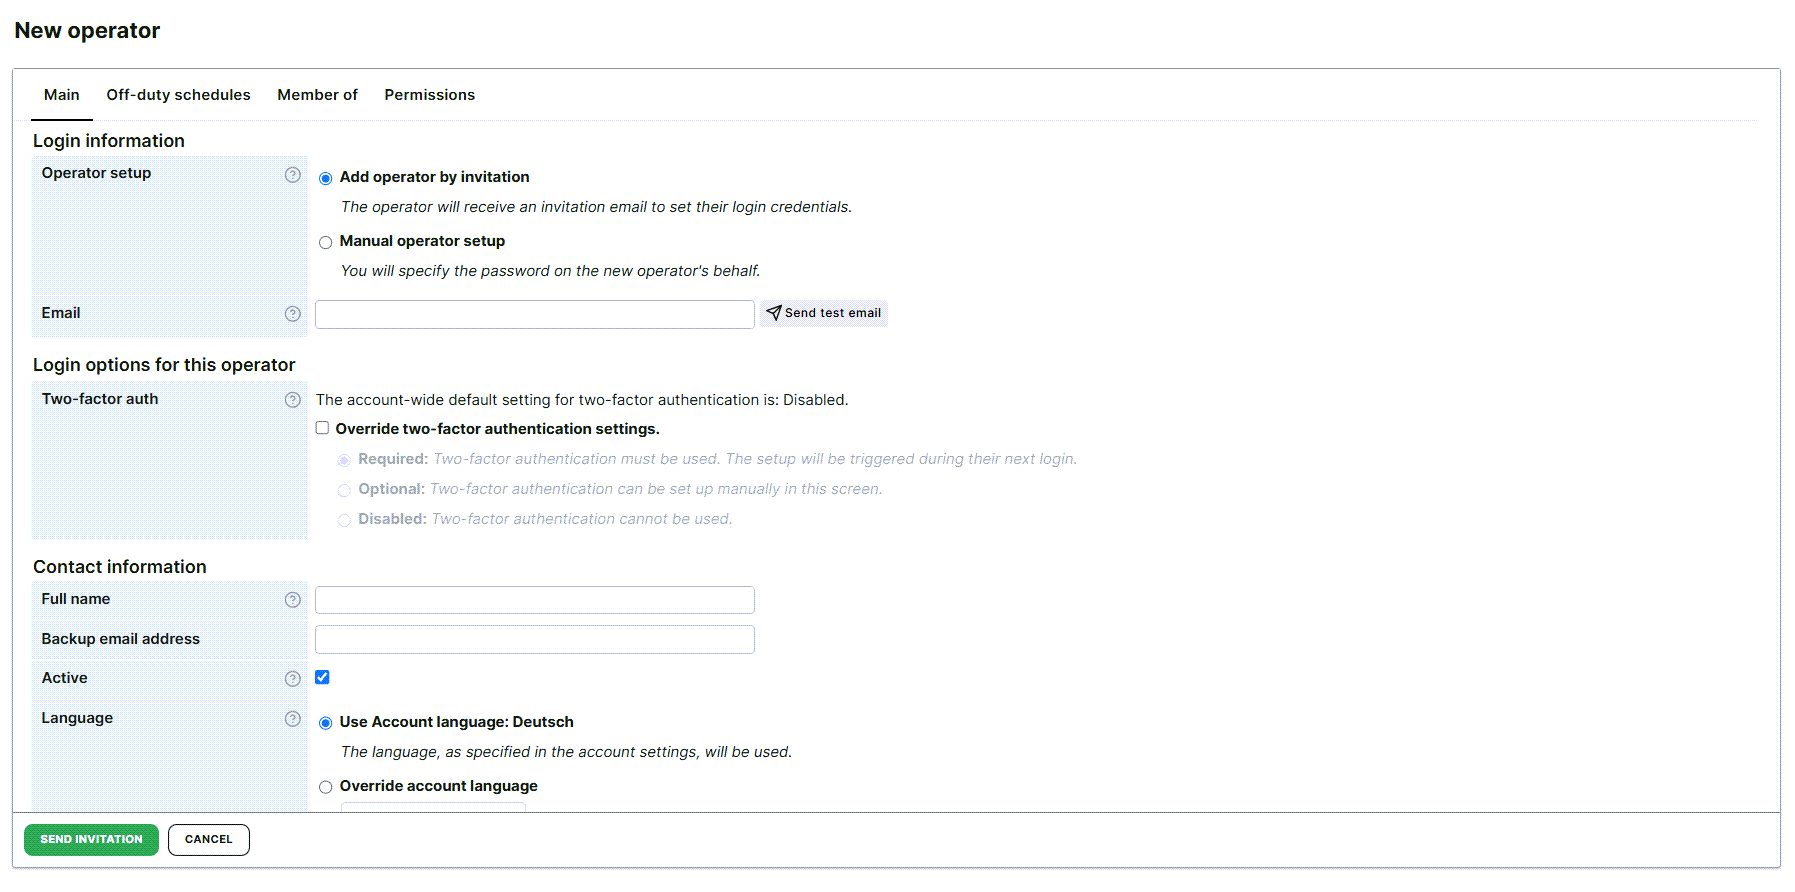
Operator Editor
Allows you to edit operator configuration, including their contact details, login options and permissions.
Administrative pages
Administrative pages allow you to manage account-level settings, such as users, roles, permissions, and subscription details.
Examples of administrative pages include:
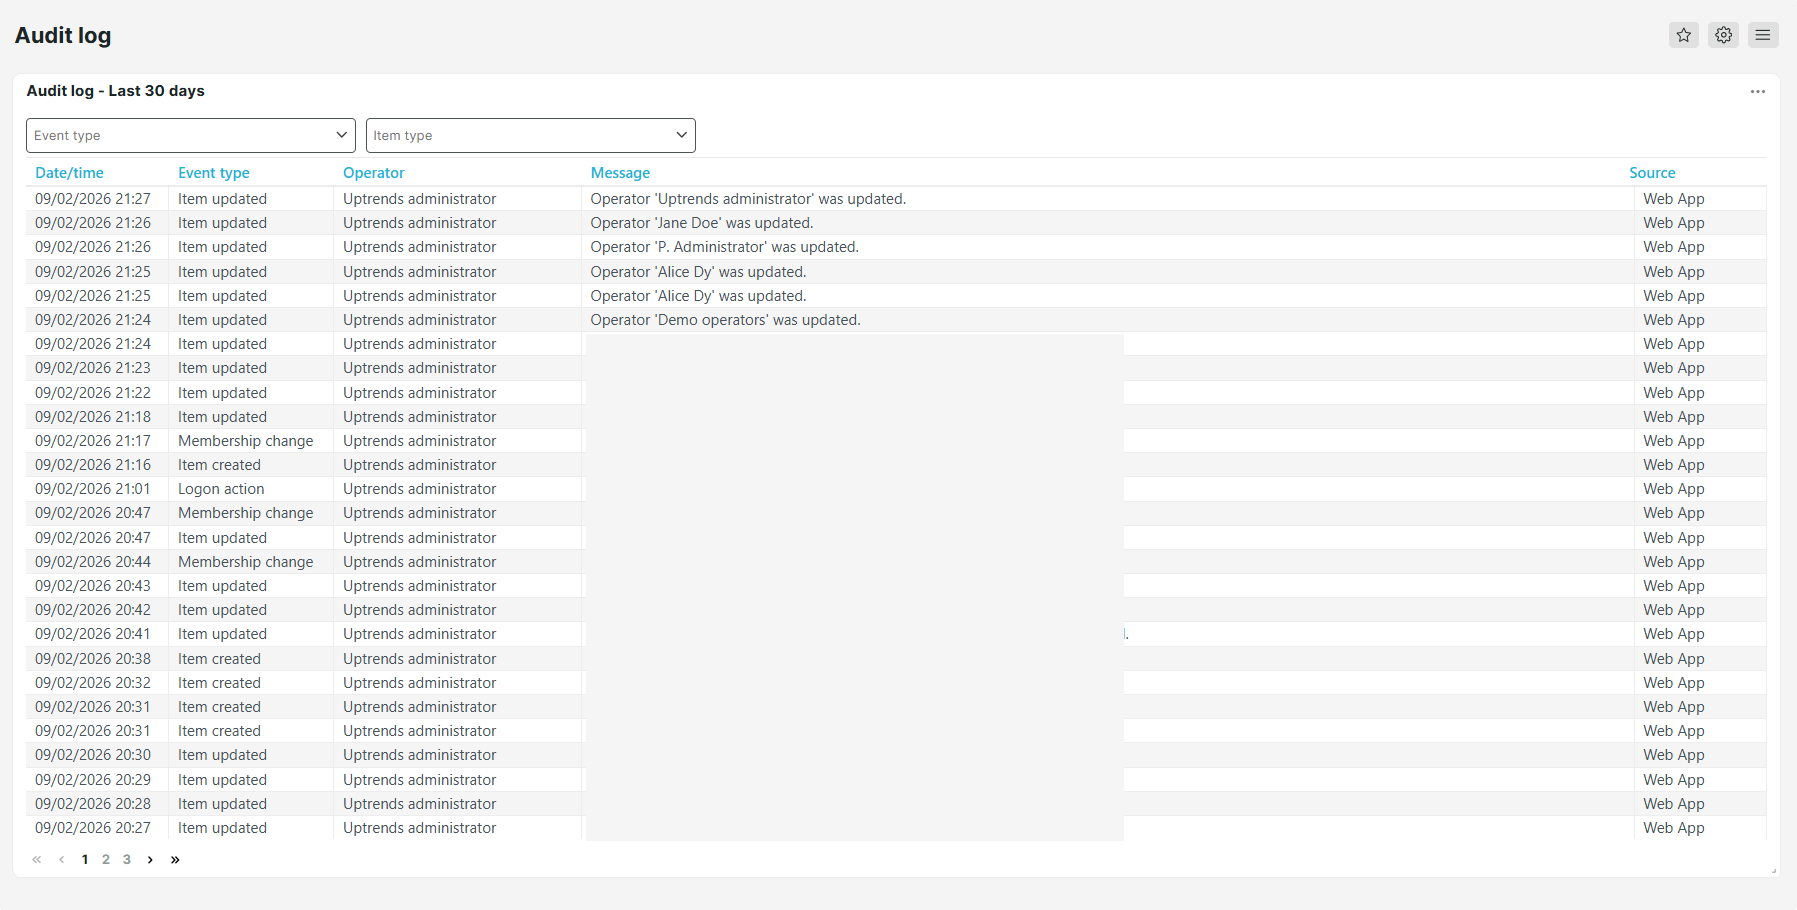
Audit log
Allows you to view records of all the activities in your Uptrends account.
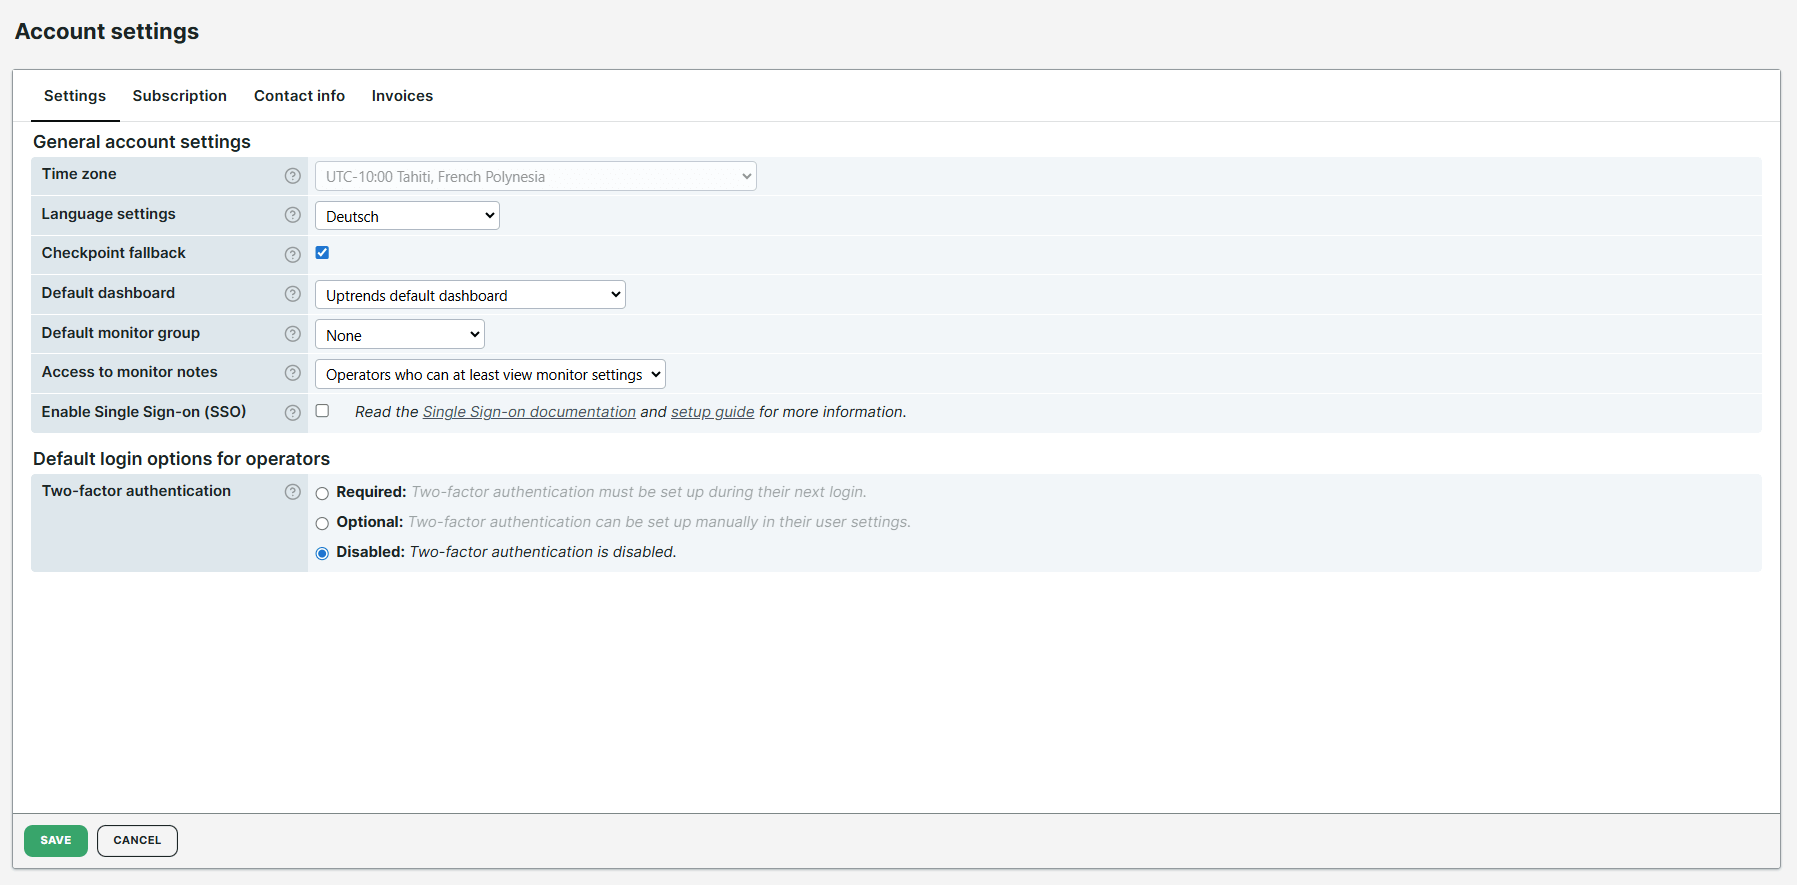
Account settings
Allows you to manage general account settings, subscriptions, and invoices.
Other pages
Other pages includes any additional pages for managing Uptrends-related capabilities, not related to any of the above.
Examples of other pages include:
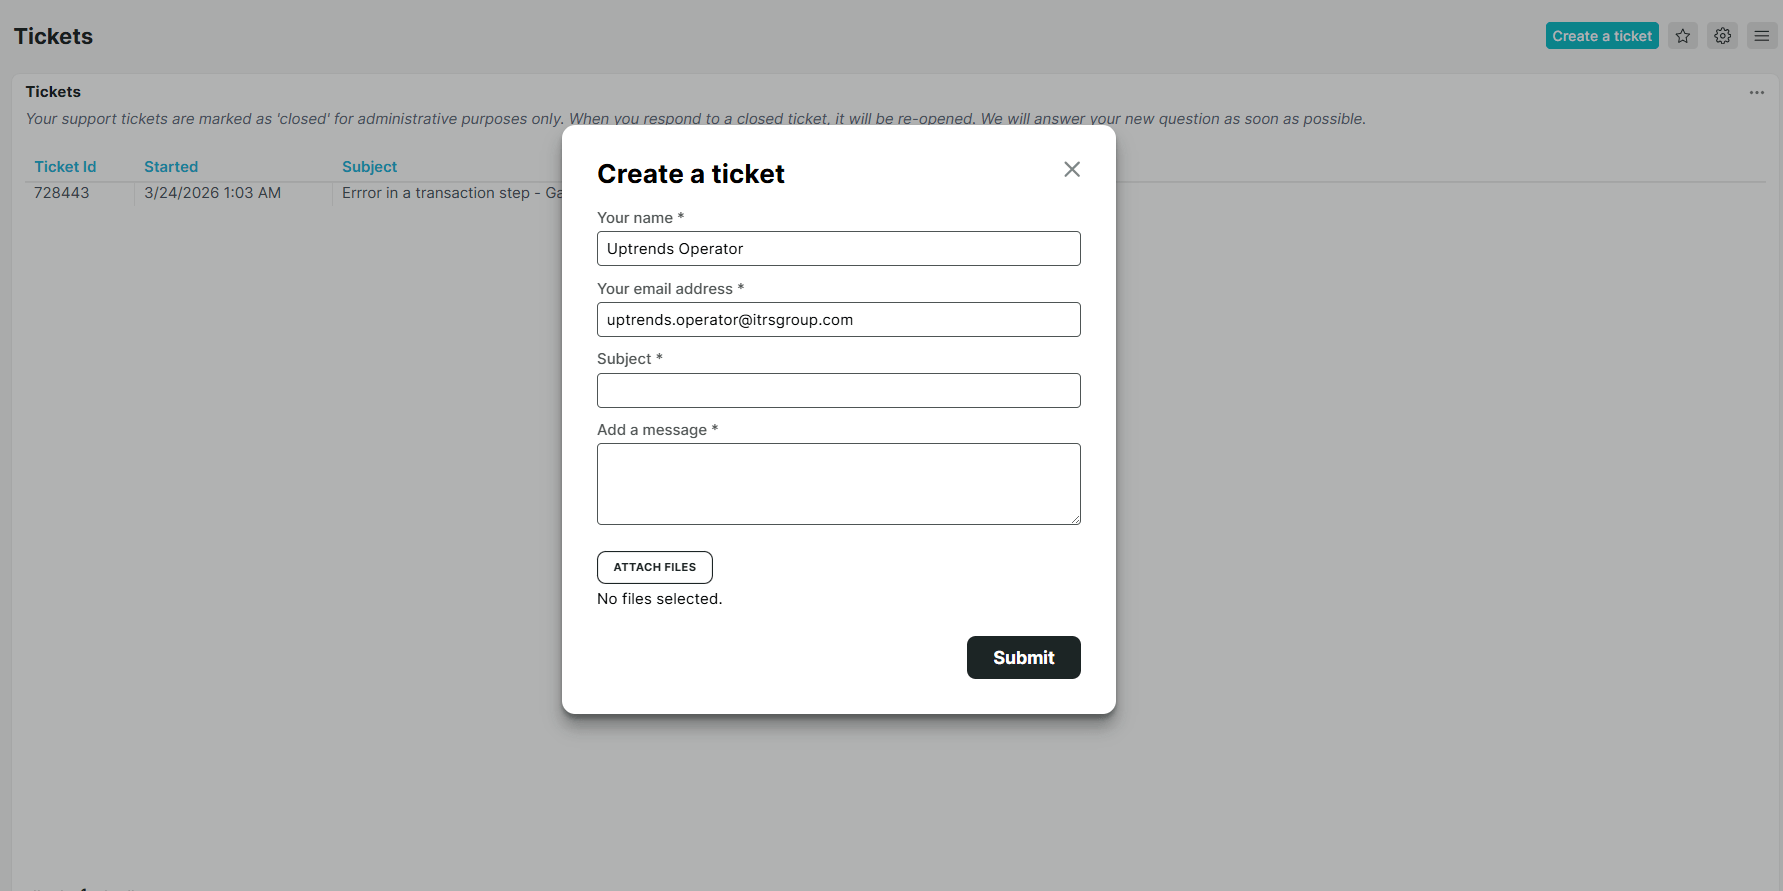
Support tickets
Allows you to submit tickets to the support team for further assistance.
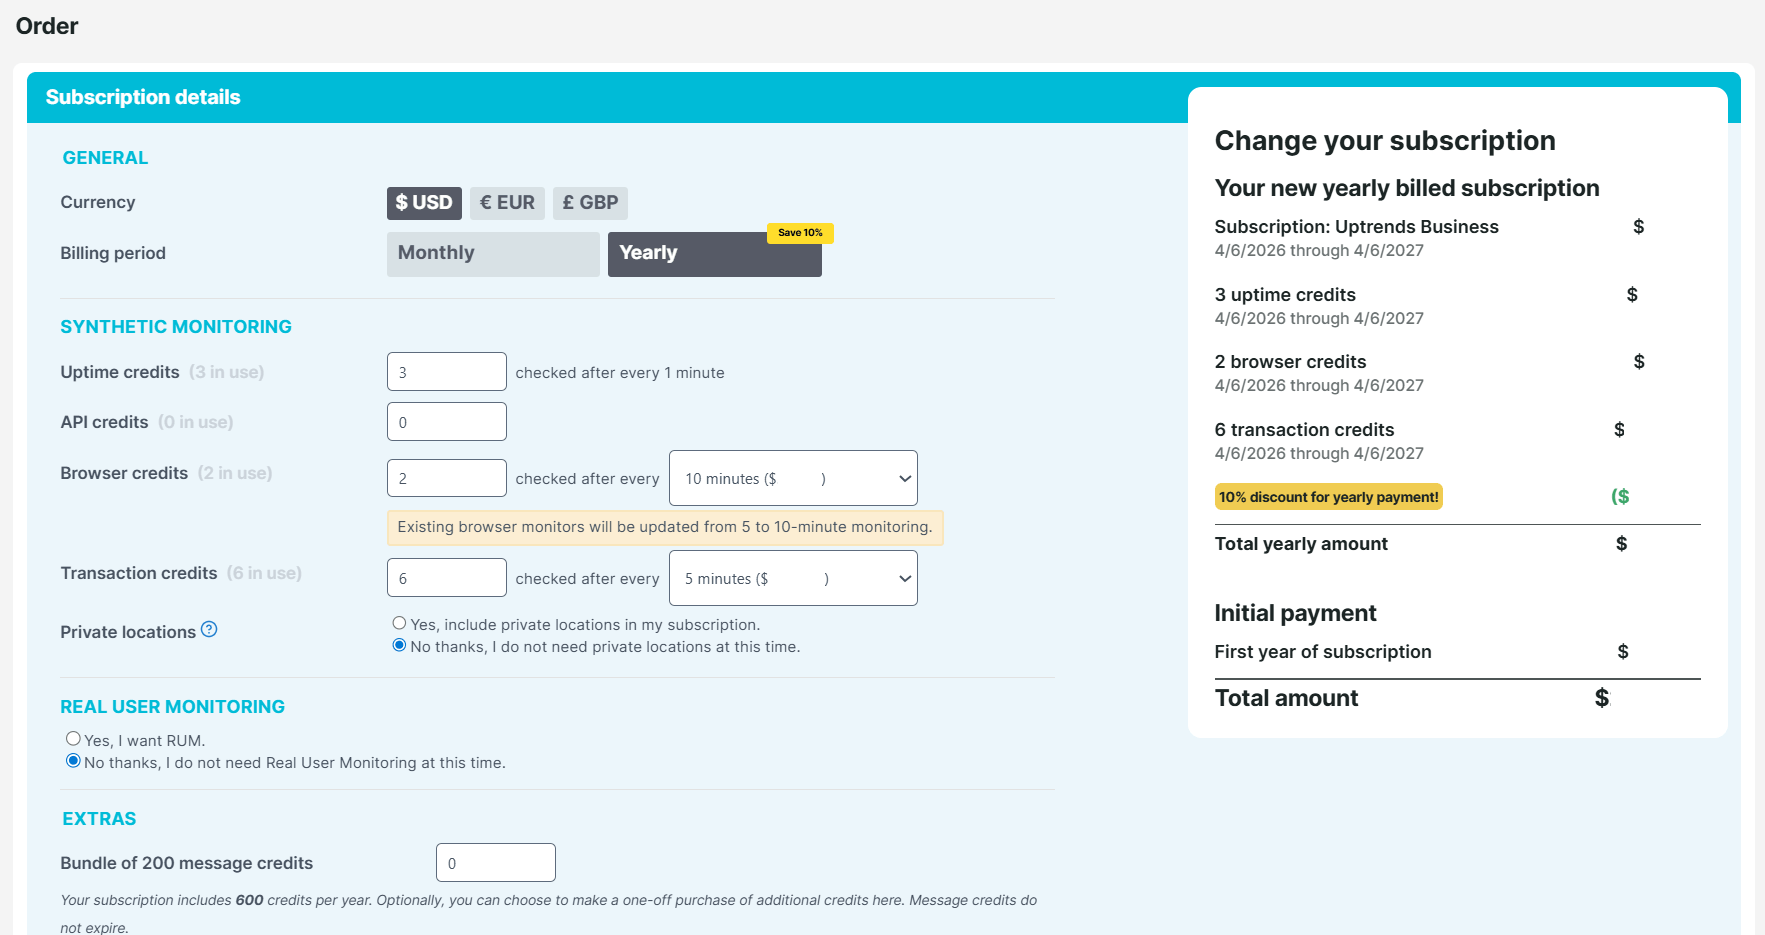
Pricing and order page
Upgrade your subscription to include additional Uptrends capabilities, such as extra credits or higher check frequencies. You can also request a custom quote based on your requirements.