If you’re just getting started with Uptrends dashboards, we recommend that you read the Dashboards overview and Custom dashboard tiles articles.
Add a custom dashboard tile

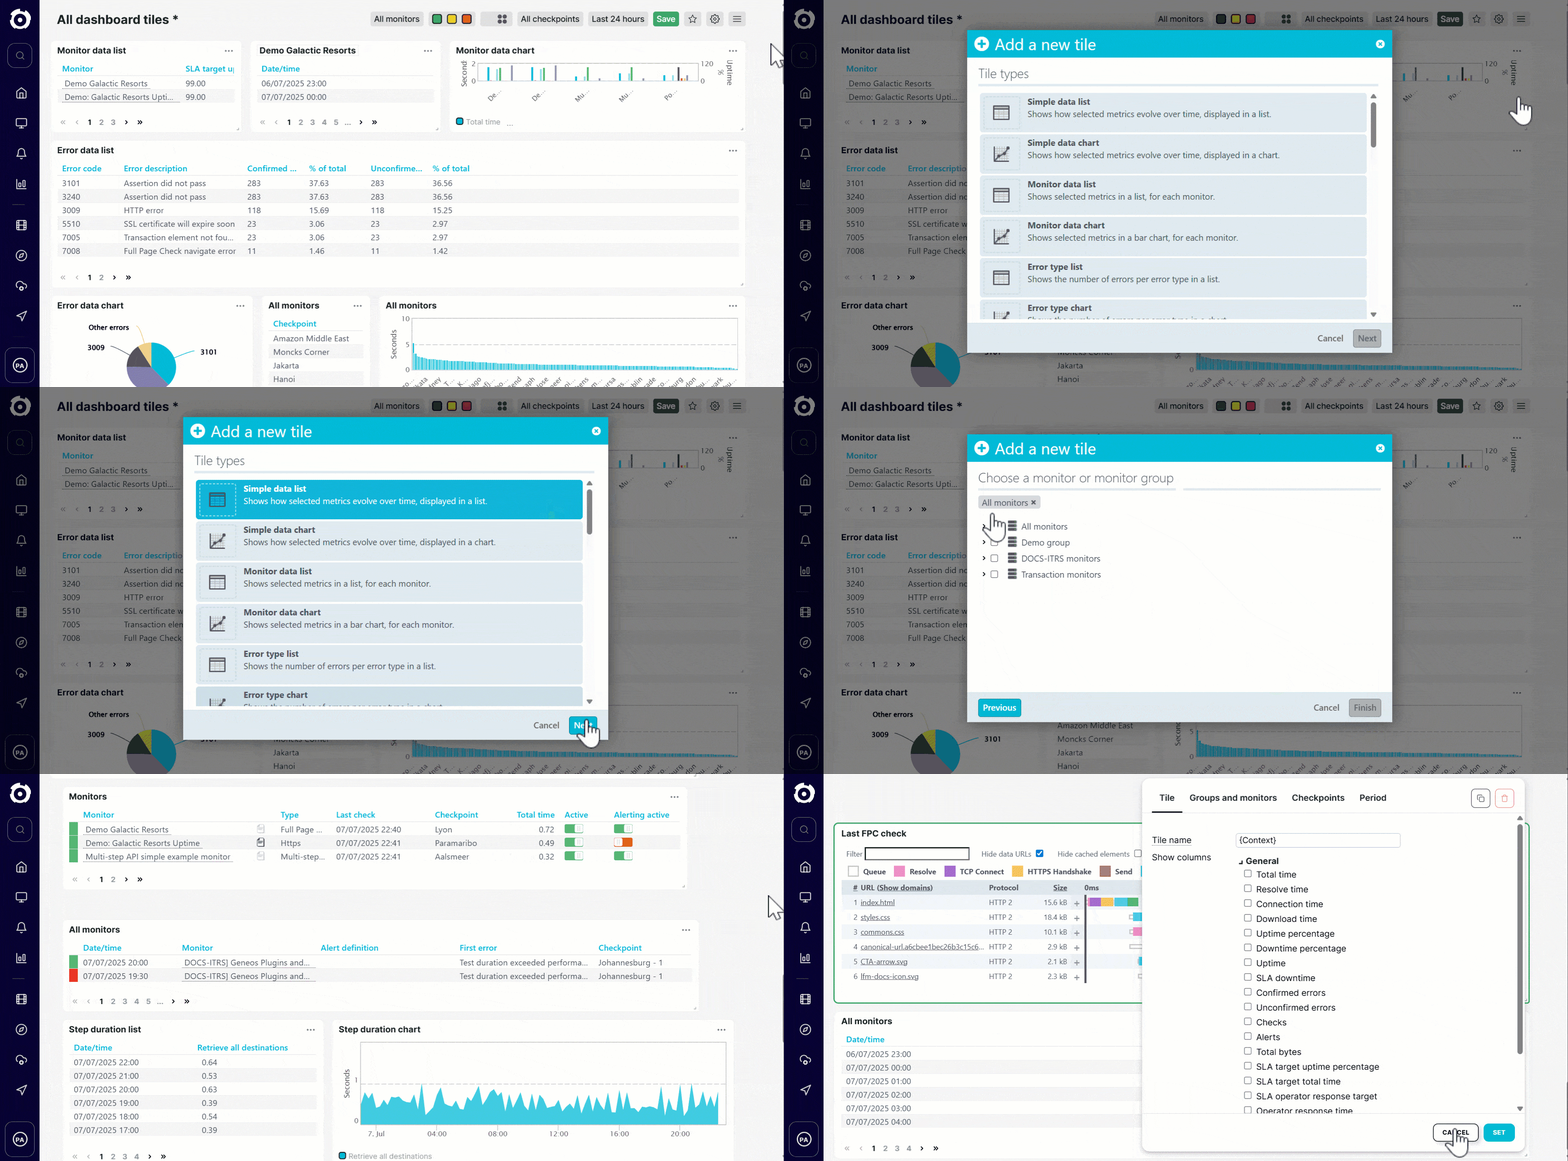
To add a custom dashboard tile:
- Go to and select a dashboard you wish to add a dashboard tile to.
- Click the at the top right of the dashboard.
- Click Add tile.
- Select a tile from the list of custom dashboard tile options.
- Click .
- Select the monitors or monitor groups you want to display with their monitor metrics and other details.
- Click .
The tile content is now displayed on your dashboard. You can continue adjusting or filtering the tile settings to change the data being shown or how it’s visualized. Whenever you make any changes to individual tiles or the dashboard, ensure that you click to confirm your changes.
Note: For newly created or modified monitors, the dashboard tile reflects the monitor data within 2 seconds. Once any initial data appears on the tile or five minutes have passed, the tile refreshes and retrieves data every 30 seconds, following the standard loading time.