If you’re just getting started with Uptrends dashboards, we recommend that you read the Dashboards overview and Custom dashboard tiles articles.
Dashboards contain dashboard tiles that let you visualize monitoring data to clearly illustrate the behavior and performance of your websites and web services. This article explains how to filter your dashboard and dashboard tile data to customize your view and focus on the most relevant information.
Dashboard filtering
You can filter any Pre-defined or Custom dashboard using the Quick Action menu located in the top right corner of the dashboard:

Below are the filtering options you can use to narrow down the data set of a dashboard.
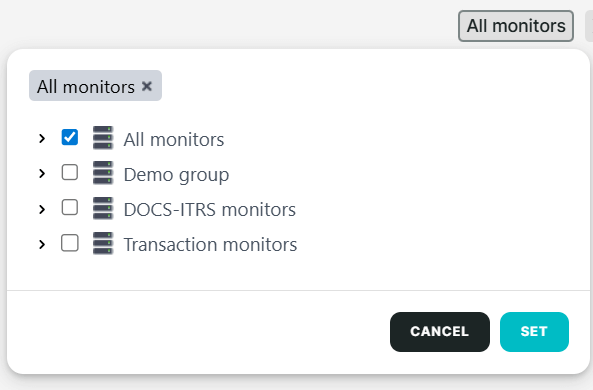
Monitor filter
Use this filter to sort data by individual monitors or monitor groups to view their corresponding monitoring details.
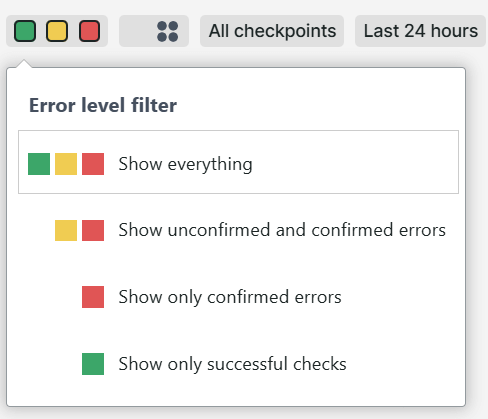
Error level filter
Use this filter to sort data by error level, such as successful monitor checks (OK results), unconfirmed, and confirmed errors.
Partial checks filter
Use this filter to sort data for monitors that use concurrent monitoring. Selecting Show partial checks displays the checks for each individual checkpoint, while Hide partial checks displays the overall check results. For more information, see Understanding concurrent monitoring results.

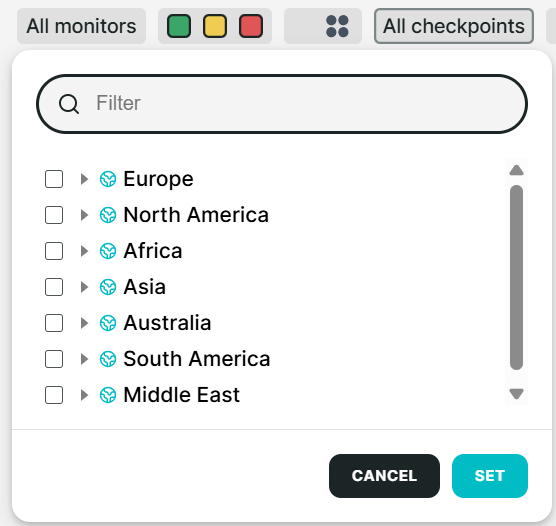
Checkpoint filter
Use this filter to sort data by checkpoint locations.
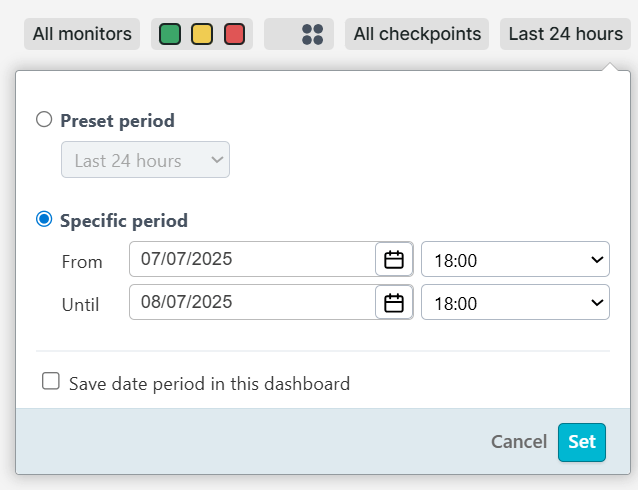
Period filter
Use this filter to sort data by time period, such as year, quarter, month, week, day, hour, or a specific date and time.
RUM dashboard filters
In addition to the standard dashboard filters above, RUM dashboards include specialized filters designed specifically for analyzing real user monitoring data. These filters allow you to analyze RUM performance across different dimensions, such as location, device type, and browser. For more information, see Real User Monitoring (RUM) dashboards.
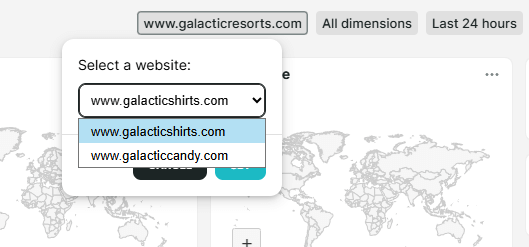
Website filter
Use this filter to view performance data for a specific website in RUM dashboards.
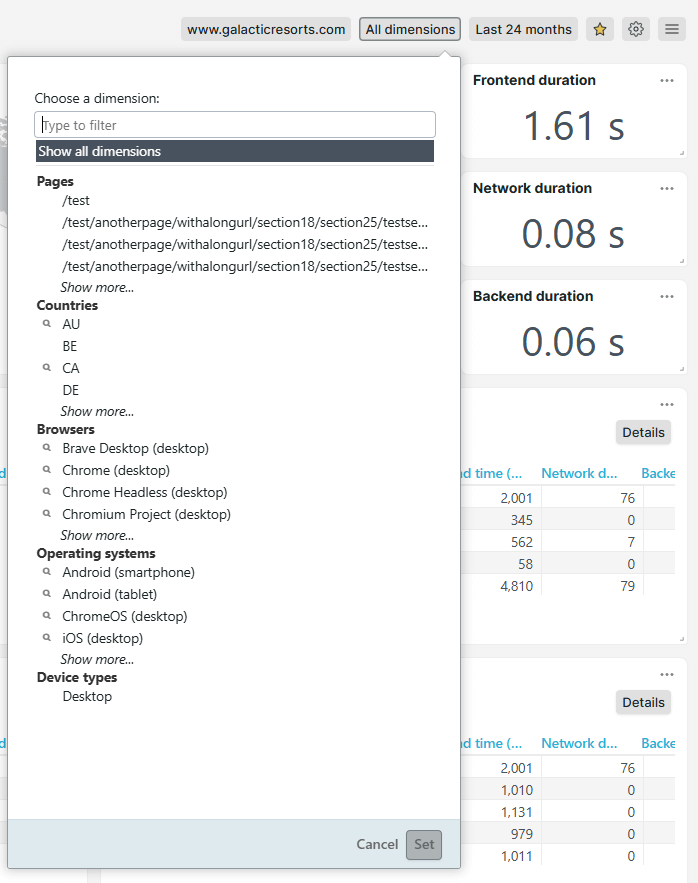
Dimension filter
Use this filter to view website data by pages, countries, browsers, operating systems, and device types, helping you analyze website performance across different dimensions in RUM dashboards.
Dashboard tile filtering
In a dashboard, you can filter the individual dashboard tiles using to access its tile settings. A pop-up appears containing a series of tabs and configuration options associated with the tile. The availability of these options may vary depending on the type of dashboard tiles.
Below are the filtering options you can use to narrow down the data set of a dashboard tile.
Below are the list of filtering options that you can use to narrow down the data set of a dashboard tile.
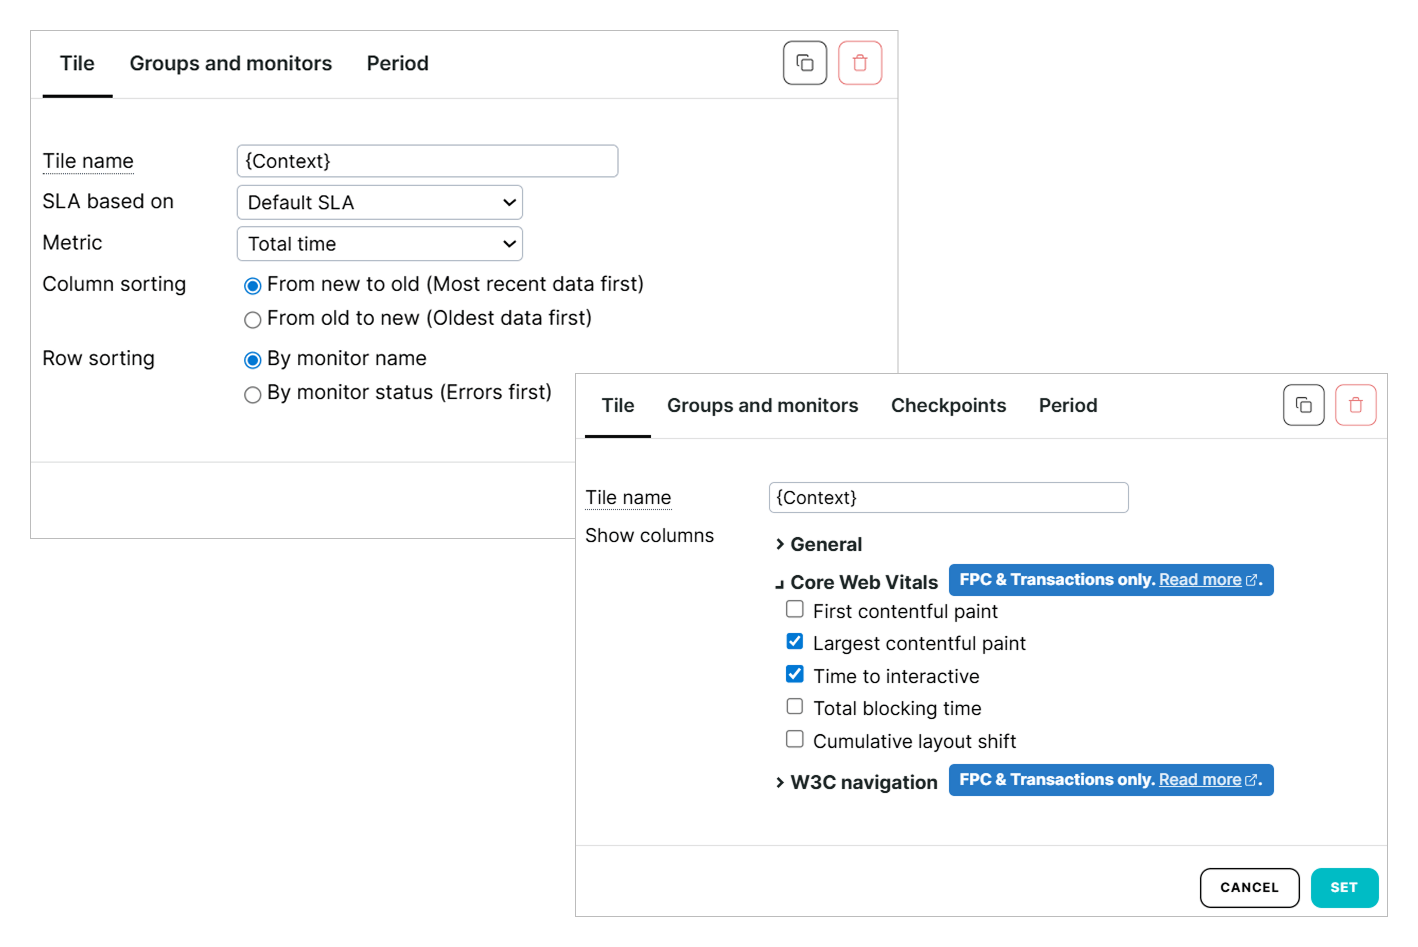
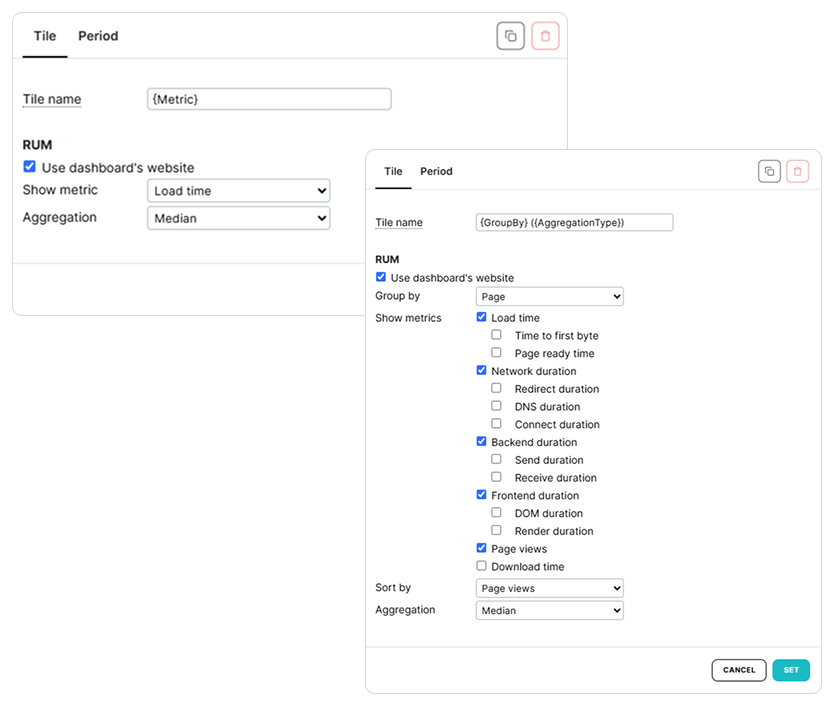
Tile tab
This tab provides filtering and sorting options that vary depending on the tile context. This tab lets you perform the following actions:
- Specify the tile name
- Hide or display specific rows or columns
- Sort by rows, columns, or alphabetical order
- Sort by monitor metrics, such as total time, connection time, and others
- Enable options for concurrent monitors
- Filter by time zones
- Filter by errors
- Filter by SLA
- Select a display mode
- Enable export options
When using Real User Monitoring (RUM) dashboards, this tab lets you filter and aggregate data by RUM website and its metrics, including the load time, page views, download time, and other website metrics.
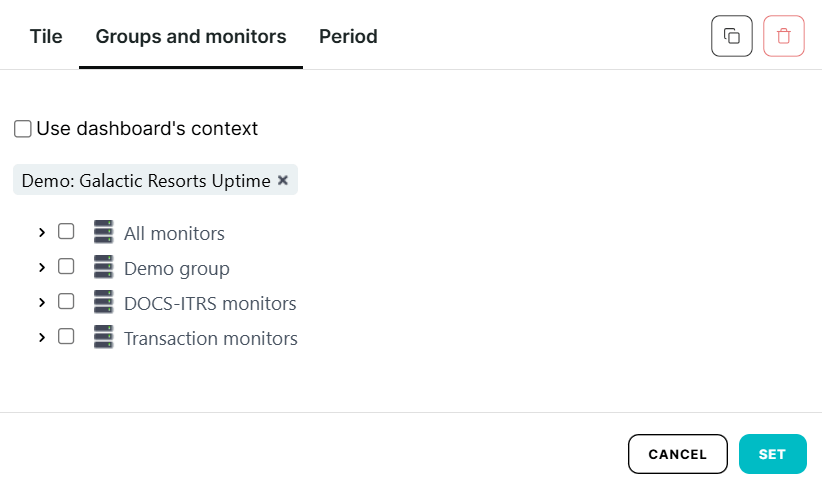
Groups and monitors
This tab provides filtering options for individual monitors, monitor groups, or for using the dashboard context. Select Use dashboard’s context to show data based on the dashboard’s setting found in the Quick Action menu, instead of manually selecting individual monitors or groups.
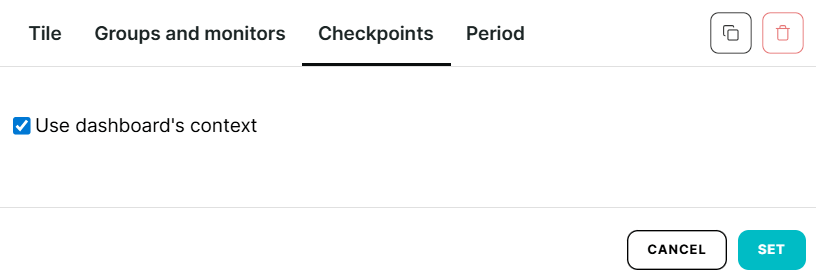
Checkpoints
This tab provides filtering options for all Uptrends checkpoint locations.
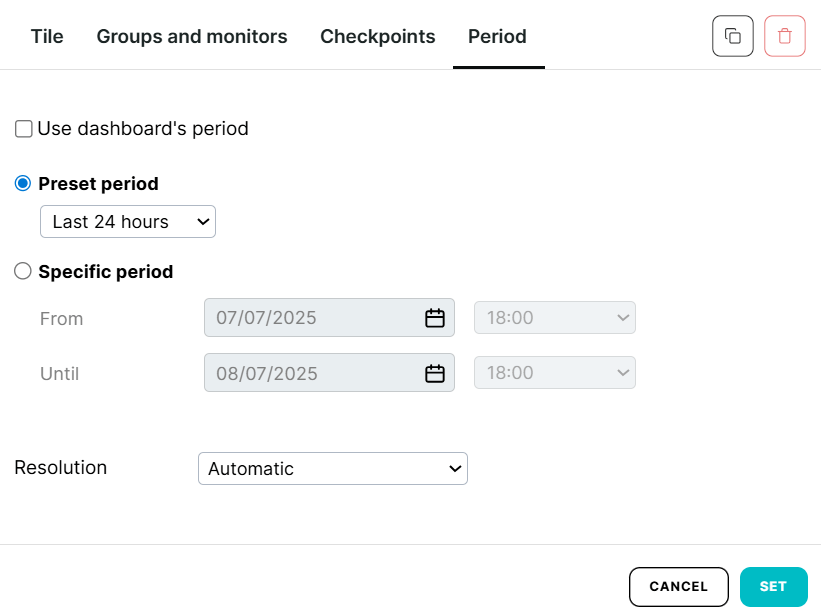
Period
This tab lets you filter and sort data based on time periods. By default, it displays data based on the dashboard’s time as shown in the Quick Action menu. You can also set the following options, which may vary depending on the tile context.
- Specify the preset period by year, quarter, month, week, day, or hour
- Specify the period using a specific date and time
- Specify the resolution period to apply a more granular filter: automatic, months, days, or hours. The Automatic option shows the time range specified in the dashboard setting itself
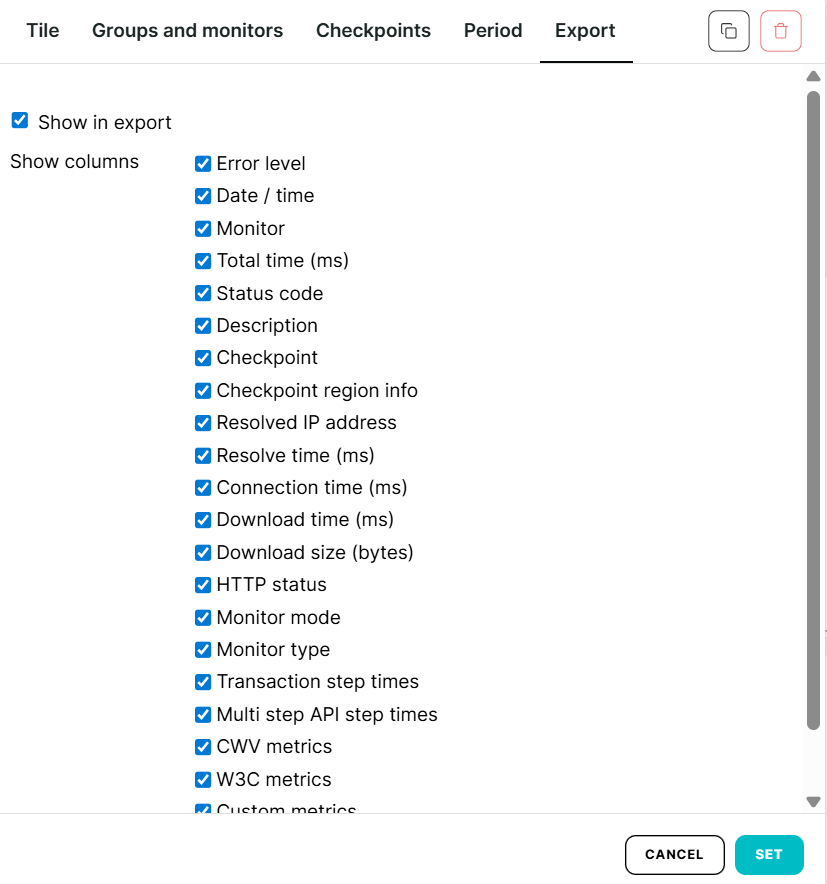
Export
This tab lets you select specific columns, such as monitor name, URL, and status code, to include when exporting a dashboard. The availability of this tab may vary depending on the type of dashboard tile. For information about exporting dashboards, see Exporting a dashboard.