
A dashboard contains a variety of dashboard tiles that lets you visualize monitoring data, such as the total time, uptime, alerts, Core web vitals, W3C navigation, error status, and other monitor metrics. These tiles can display data as lists or charts, showing information in tabular formats, line graphs, bar graphs, and pie charts.
This article provides detailed information about the available types of dashboard tiles and how you can use and customize them based on your monitoring needs.
Types of dashboard tiles
Default dashboards may already include dashboard tiles based on the monitor type. You can either add additional tiles to these dashboards or create your own custom dashboards.
Below are the different types of dashboard tiles available for use. You can also filter each tile to check specific metrics or adjust the time period.
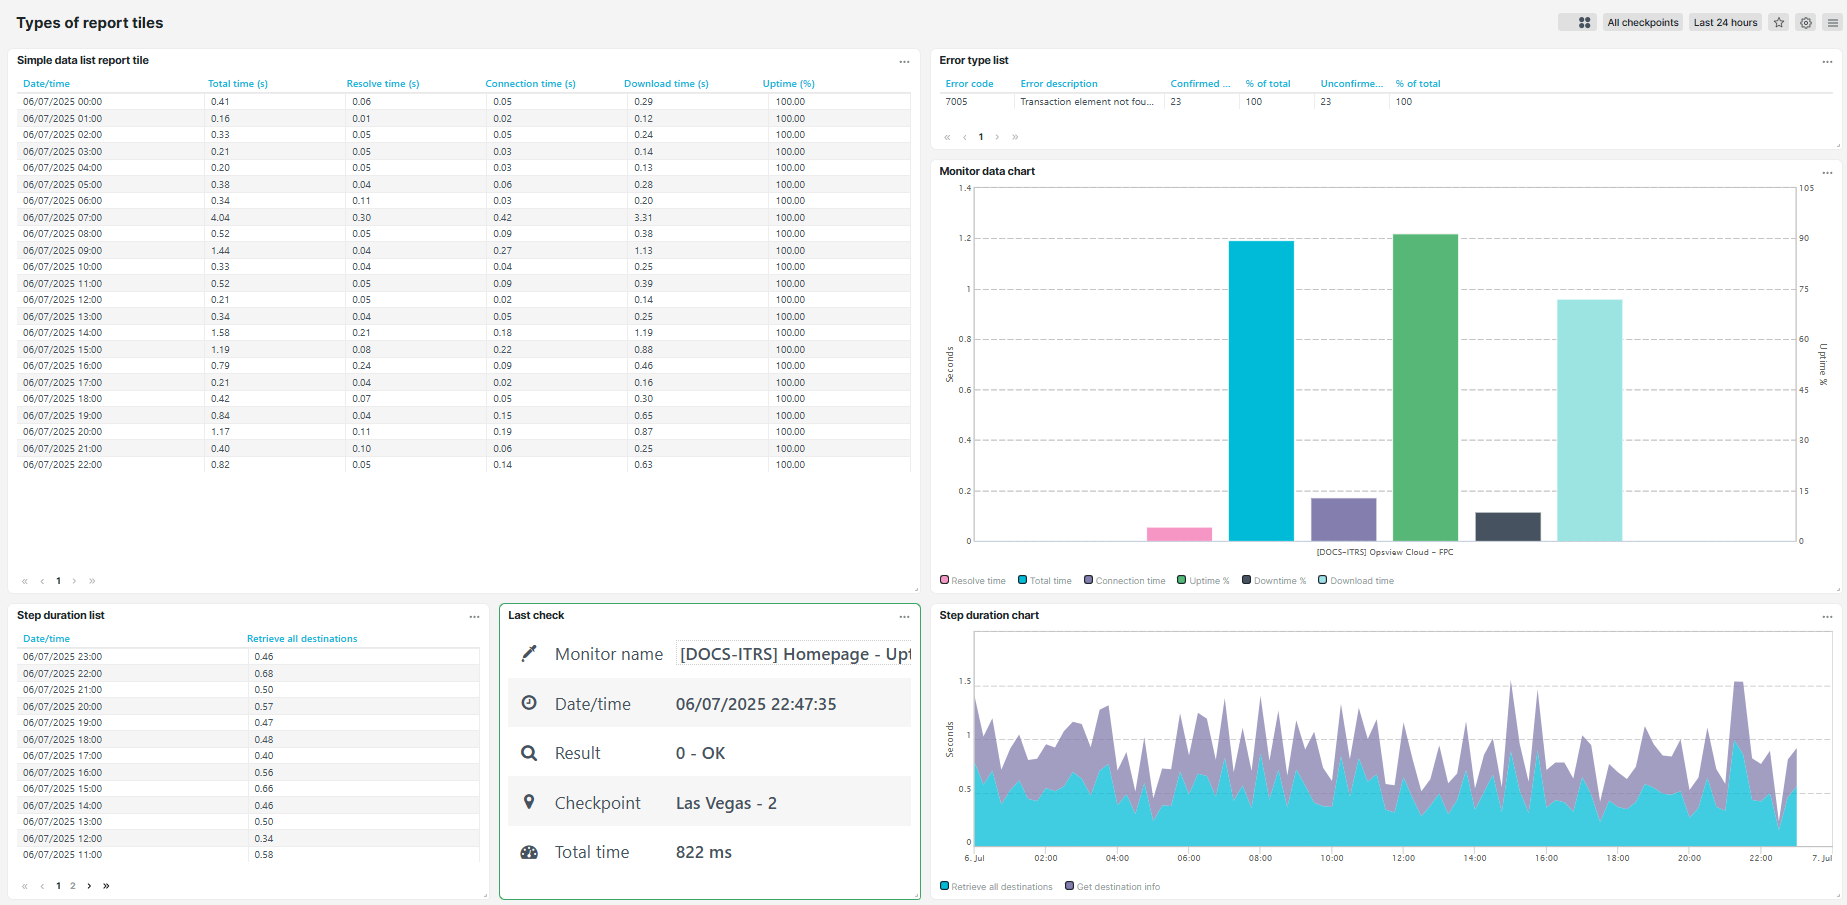
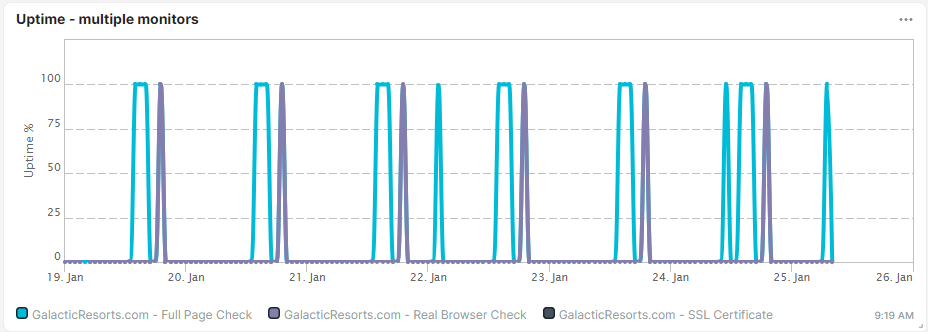
Simple data list or chart
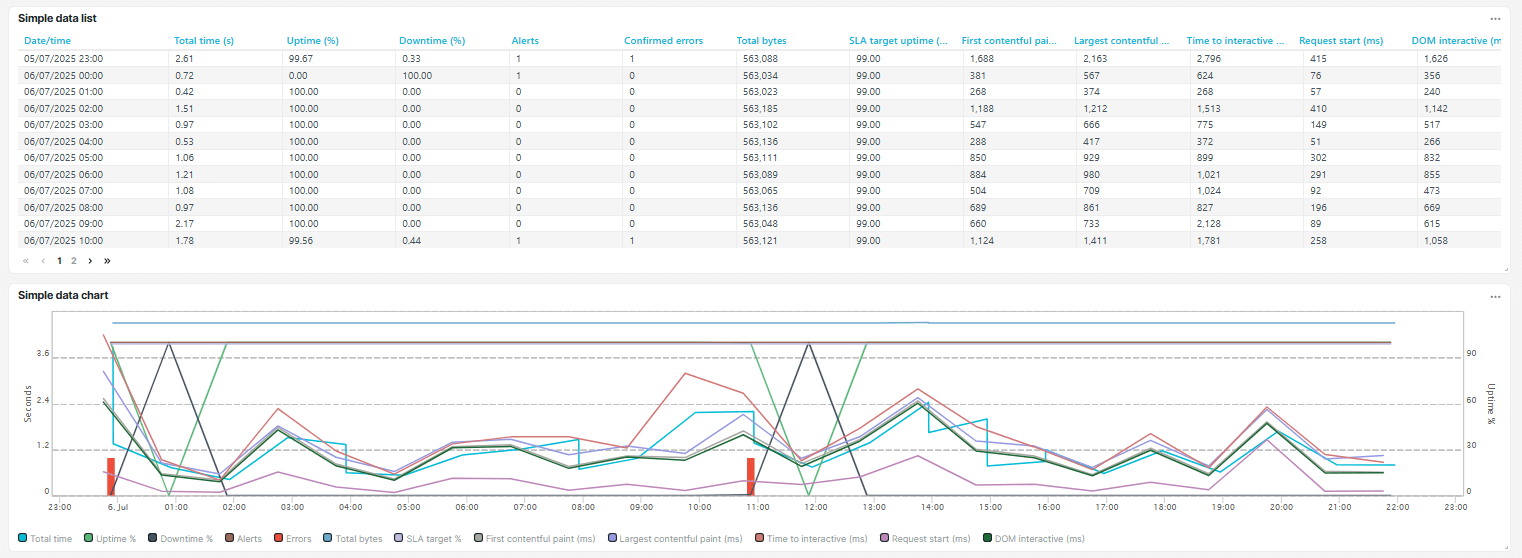
This type of dashboard tile allows you to select monitors or monitor groups to display metrics from the General, Core Web Vitals, and W3C navigation options. The availability of these options may vary depending on the monitor type. For the Simple data chart tiles, the metrics are displayed through a graph. You can check the legend and hover over the graph for more information about the metric.
General
The General option allows you to show the following metrics that will be reflected in the dashboard tile:
- Total, resolve, connection, and download times
- Uptime percentage, downtime percentage, uptime, and downtime
- Confirmed and unconfirmed errors
- Number of checks, alerts, and total bytes
- SLA target uptime percentage, SLA target total time, SLA operator response target, and operator response time
Core Web Vitals
The Core Web Vitals option allows you to show the following metrics that will be reflected in the dashboard tile:
- First contentful paint
- Largest contentful paint
- Time to interactive
- Total blocking time
- Cumulative layout shift
For more information, refer to the Core Web Vitals article.
W3C navigation
The W3C navigation option allows you to show the following metrics that will be reflected in the dashboard tile:
- Request start
- Time to first byte
- DOM interactive
- DOM completed
- Load event
For more information, refer to the W3C navigation article.
Monitor data list or chart
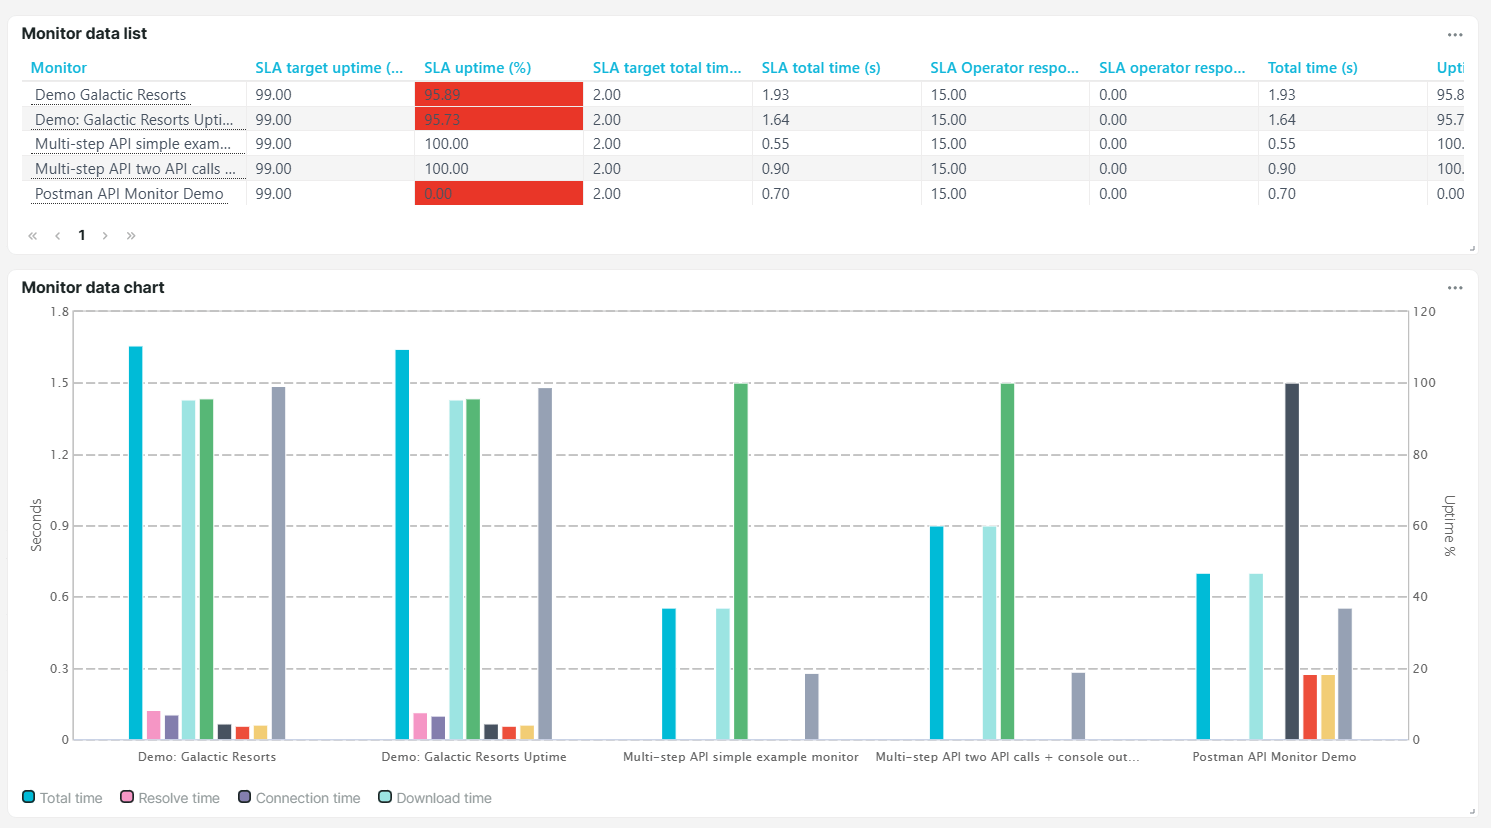
This type of dashboard tile allows you to select monitors or monitor groups to display the following metrics:
- SLA uptime percentage and SLA target uptime percentage
- SLA total time, SLA target total time, and SLA downtime
- SLA operator response time and SLA operator response target
- Total time, Number of checks, Confirmed errors, and unconfirmed errors
- Uptime percentage and downtime percentage
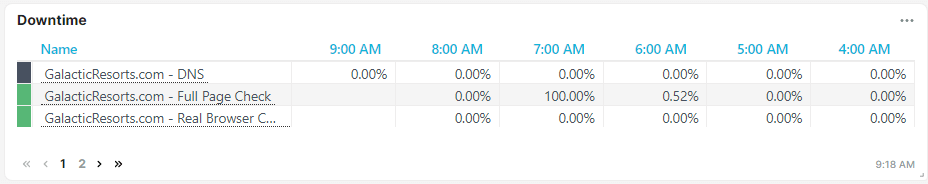
Error type list or chart
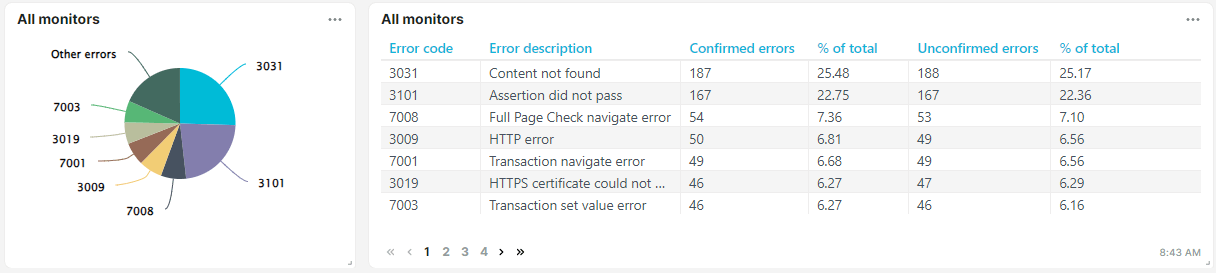
This type of dashboard tile allows you to select monitors or monitor groups to display the confirmed, unconfirmed, and other error metrics. You can find more information about the error codes on the Error Types article.
Checkpoint data list or chart
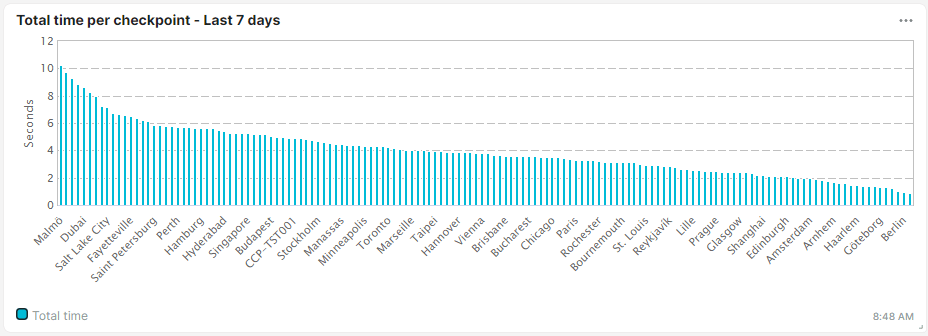
This type of dashboard tile allows you to select monitors or monitor groups to display the following metrics:
- Total, resolve, connection, and download times
- Confirmed errors
- Number of checks
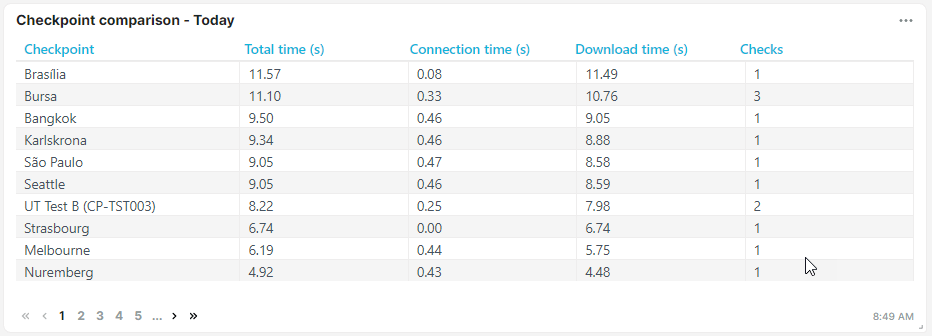
Multi-checkpoint list or chart
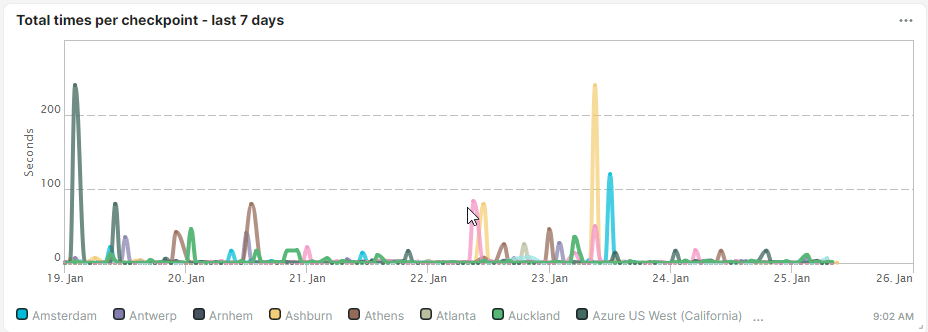
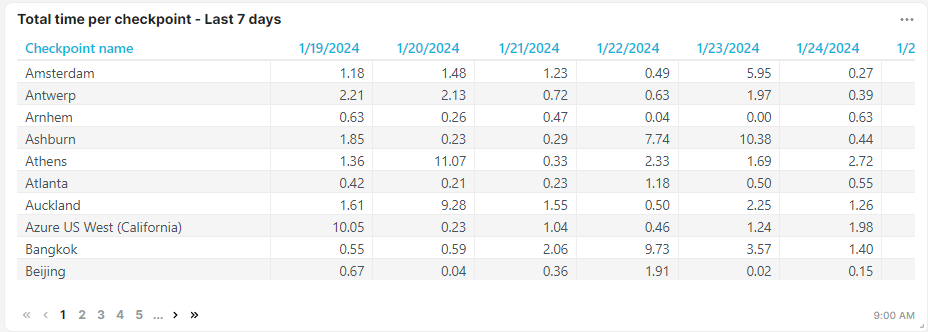
This type of dashboard tile allows you to select monitors or monitor groups to display the total, resolve, connection, and download times metrics.
Multi-monitor list or chart
This type of dashboard tile allows you to select monitors or monitor groups to display the following metrics:
- Total, resolve, connection, and download times
- Uptime percentage and downtime percentage
- Confirmed and unconfirmed errors
- Number of checks
- SLA target uptime percentage and SLA uptime compliance
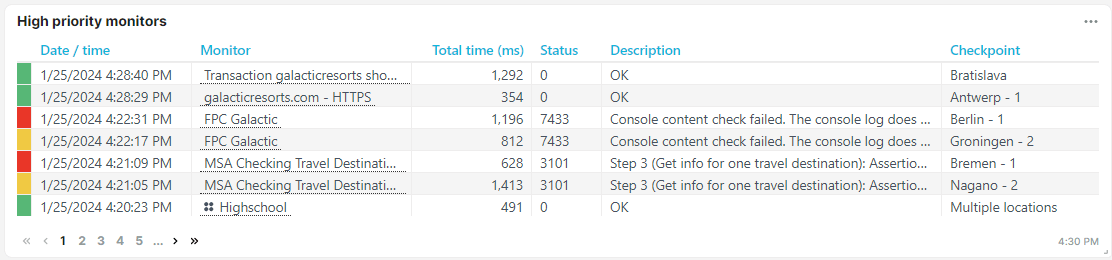
Last check details
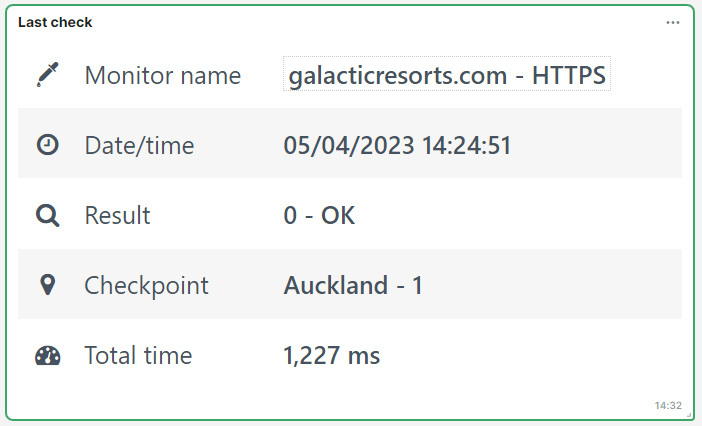
This type of dashboard tile allows you to select monitors or monitor groups to display the following metrics:
- Monitor name
- Date and time when the monitor was last checked
- Monitor result
- Checkpoint location
- Total time
- Number of checks
- Confirmed errors
- SLA uptime percentage
- URL or network address that you are monitoring
- Total size in bytes
Monitor group details
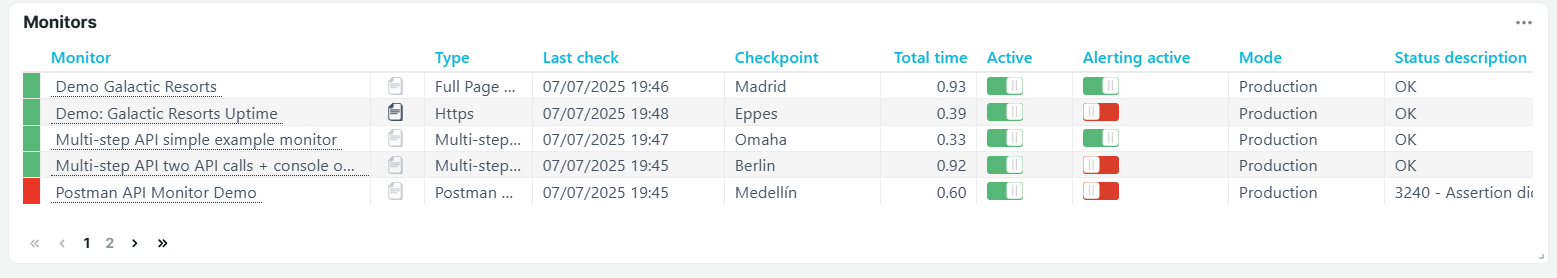
This type of dashboard tile allows you to select monitors or monitor groups to display the monitors and their metrics:
- Monitor name
- Monitor type
- Checkpoint location
- Total time
- Monitor status (if the monitor is enabled or disabled)
- Alerting status (if alerting is enabled or disabled)
- Monitor mode
- Monitor result (Status description)
For more information, refer to Monitor group.
Monitor log
This type of dashboard tile allows you to select monitors or monitor groups to display the monitor checks and their metrics:
- Date and time of when the monitor was checked
- Monitor name
- Total time
- Status code
- Monitor result
- Checkpoint location
Below metrics are also available once you export the dashboard tile:
- Error level
- Checkpoint region information
- Resolved IP address
- Download size
- HTTP status
- Monitor mode
- Monitor type
- Resolve, connection, and download times
- Transaction step times (for transaction monitors)
- Multi-step API step times (for Multi-step API monitors)
- Core Web vitals (CWV) metrics
- W3C metrics
- Custom metrics
Alert history
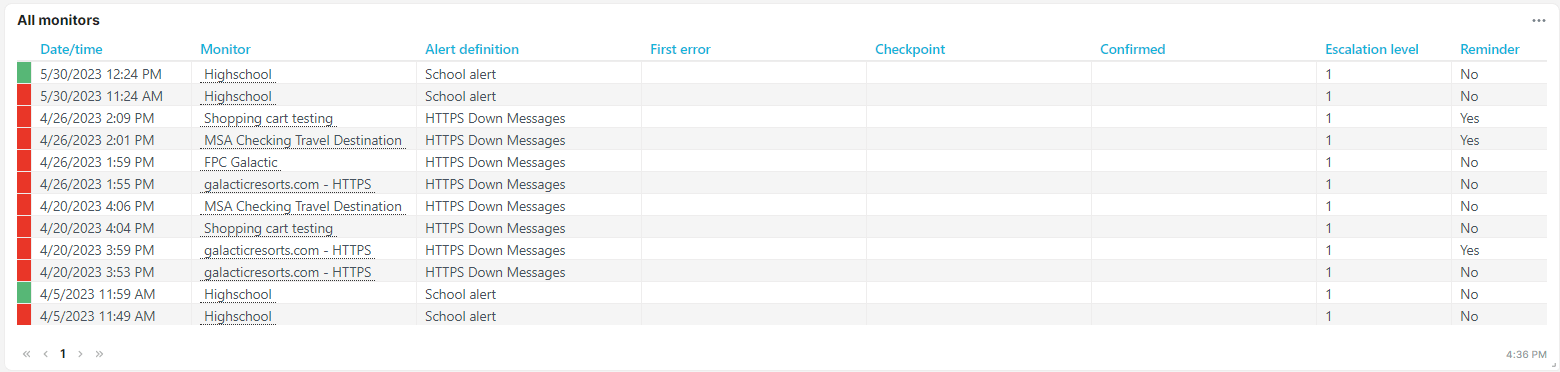
This type of dashboard tile allows you to select monitors or monitor groups to display the alert history and their details:
- Monitor name
- Alert definition
- First error
- Checkpoint location
- Confirmed errors
- Escalation level
- Alert reminders in escalations
For more information, refer to Alerting.
Last Full Page Check details
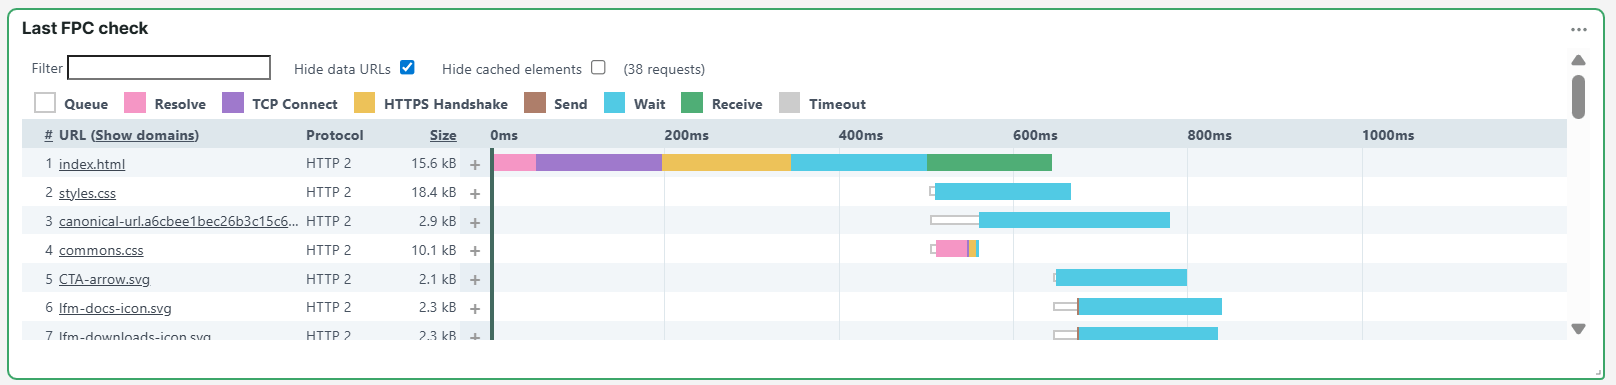
This type of dashboard tile allows you to select monitors or monitor groups to display their Waterfall chart and Waterfall timing metrics.
Step duration list or chart
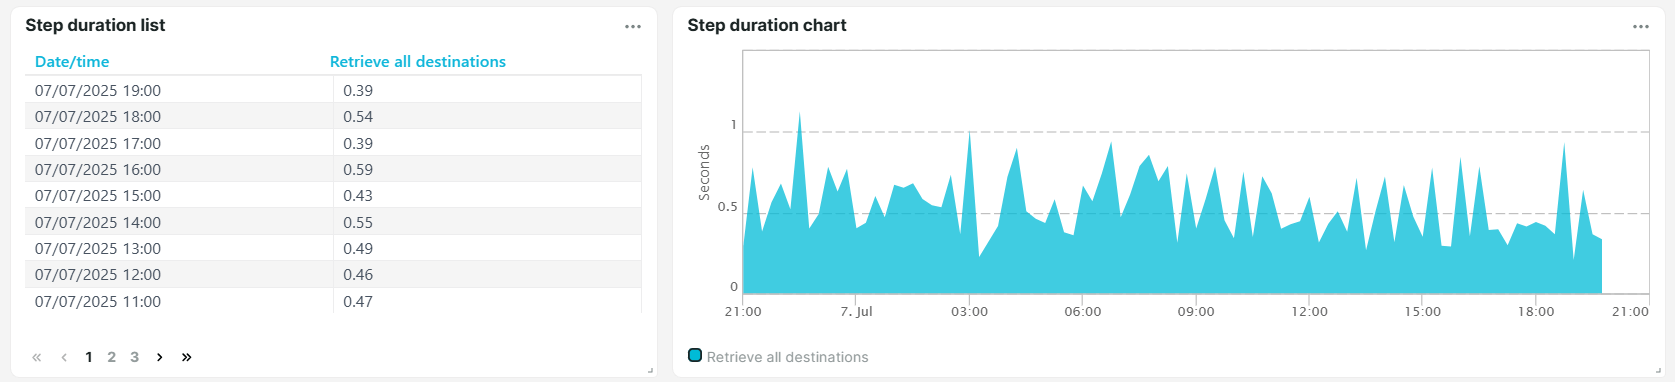
This type of dashboard tile allows you to select monitors or monitor groups to display the executed monitor steps and their execution times in seconds. Note that these tiles are only available for transaction and Multi-step API monitors. The tiles only display one monitor at a time.
Average step duration list or chart
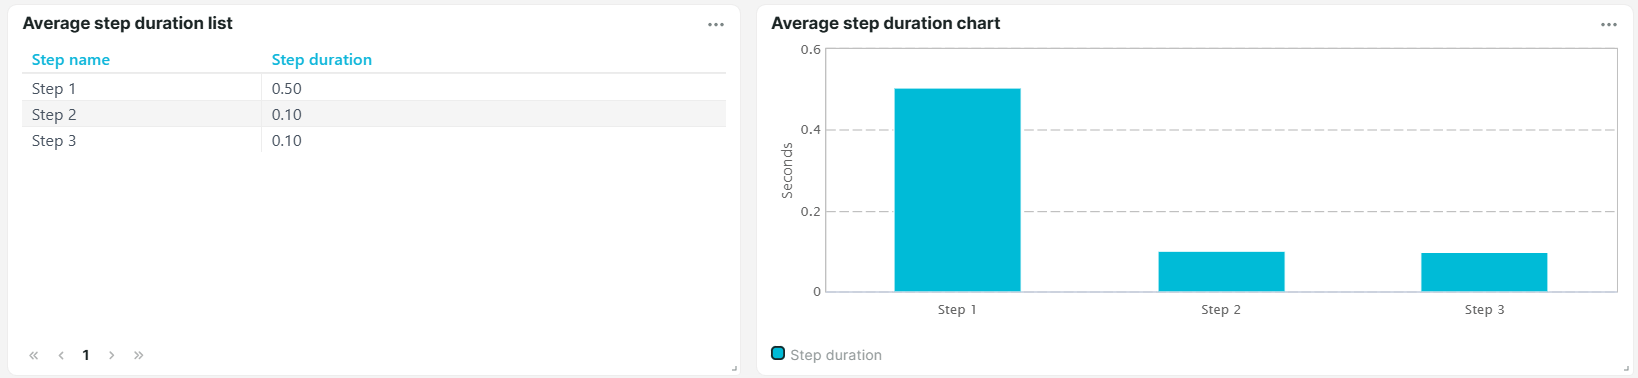
This type of dashboard tile allows you to select monitors or monitor groups to display the average step execution time. Note that these tiles are only available for transaction and Multi-step API monitors. The tiles only display one monitor at a time.
Custom metrics list or chart
This type of dashboard tile allows you to select specific monitors or monitor groups to display Custom metric variables and analyze their performance trends over time.
The Custom metrics chart displays metric variables as a line graph, showing minimum, average, and maximum values that are color-coded and plotted on the chart. This makes it easier to spot trends and compare performance over time.
The Custom metrics list displays the metric variable as a table. The list shows the Date/time when the metric was retrieved and its minimum, average, and maximum values:
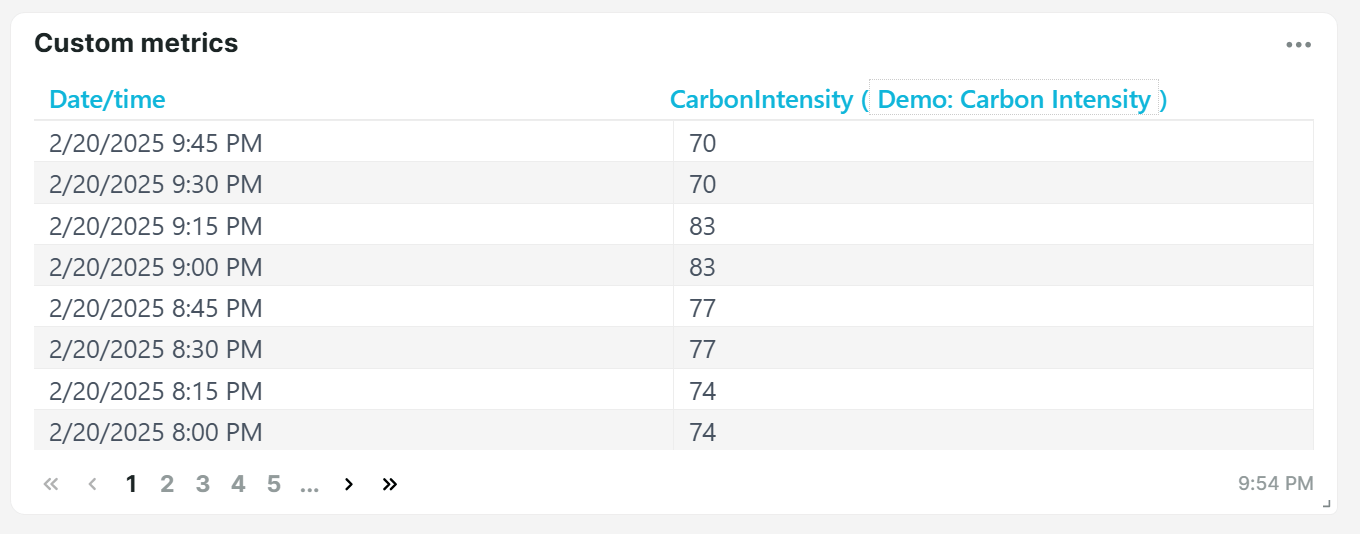
Note that you can select multiple custom metric variables to compare values in a list or chart. For more information, refer to Custom metrics setup.