There are two different ways in which you can filter your dashboard data: by individual tile (which enables you to see two similar tiles side-by-side, but with different settings), or applying a filter across the entire dashboard.
Dashboard filtering
To filter across an entire dashboard, open the dashboard in question and then use the filter options of the Quick Action menu (at the top right of the dashboard).

You will see a variety of filtering options that change based on the dashboard you are on, including:
- Monitor filtering
This filter comes in handy if you’re looking to only see data for certain monitors. You can select one or more monitor(s) or monitor group(s) . - Error level filtering
This filter enables you to display everything, only unconfirmed/confirmed errors , only confirmed errors or only successful checks (OK results). - Partial checks filtering
A filter for concurrent monitoring only which allows you to show or hide partial checks. - Checkpoint filtering
Displays data output filtered by certain checkpoints . - Date/Time filtering
Filter by a specified time frame.
Tile filtering
To filter within an individual tile:
-
Access the dashboard that contains the tile you wish to filter.
-
On the tile in question open the three-dot menu to access the tile settings. A pop-up window will appear, containing a series of tabs and configuration options associated with the tile.
It depends on the tile type which tabs and options are available. These can be (a combination of):
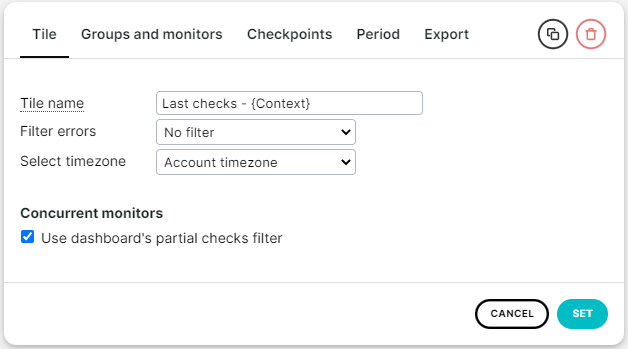
Tile
The options contained in the Tile tab relate only to the way data is presented in that tile.Groups and monitors
The Groups and monitors tab enables you to display data pertaining to the context of the dashboard (typically the default) or to filter it to show data for any series of monitors or monitor groups.Checkpoints
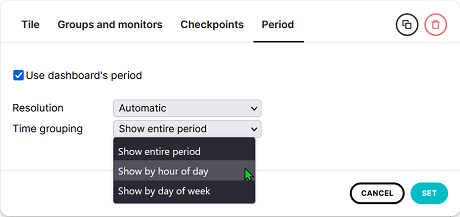
Filter data by the checkpoint(s) that carried out the monitoring checks. See the steps for Checkpoint filtering below for more information.Period
The Period tab enables you to filter the time frame in which to show data, typically set by default to the context of the dashboard. -
Set all filters that you want to apply to the tile.
-
In the tile settings dialog click the button.
-
Important: your changes are not automatically saved. Whenever you make any changes to individual tiles (or the dashboard), be sure to save them using the button at the top right of your dashboard.
Checkpoint filtering for tiles
Checkpoint filters are available for the tile types :
- Simple data list/chart
- Checkpoint data list/chart
- Multicheckpoint list/chart
- Step duration list/chart
- Monitor log
To apply a checkpoint filter to a tile:
-
Go to the menu .
-
Select a dashboard.
-
Open a tile’s three-dot menu to access the settings.
-
Go to the Checkpoints tab.
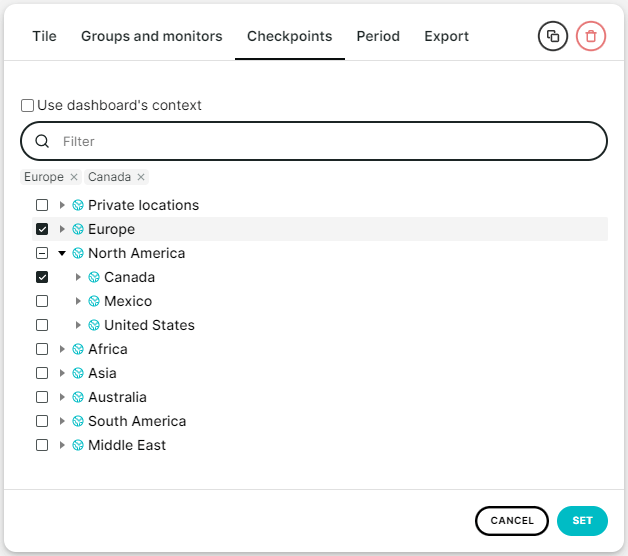
-
Select the checkpoint(s) which you need the tile to display check data from.
You can select individual checkpoints, checkpoint regions or countries (within regions). -
Click the button.
-
Click the button at the top right of your dashboard.
Note: Two exceptions apply to checkpoint filters:
- Extra metrics with label ‘FPC & Transactions only’. When one of them is selected on the Tile tab together with a checkpoint filter Uptrends will show a warning.
- When Time grouping Show by hour of day is selected on tab Period and a checkpoint filter is active, a warning will be displayed.