
The Uptrends Grafana data source allows information about the status and statistics reported by Uptrends monitors and monitor groups to be displayed within a Grafana environment. It makes use of the Uptrends API to retrieve statistical data, or data about the current status, for your monitors and monitor groups.
This guide describes how to set up a basic Grafana instance that can connect to and pull data from Uptrends, so that it can be displayed in your Grafana environment. If you encounter any issues, have any questions, or would like to submit feedback, please contact us.
Prerequisites
- An active Uptrends account.
- A set of Uptrends APIv4 credentials: this guide will cover how to generate those.
- A Grafana instance with access to the server configuration.
Pre configuration
Create an Uptrends APIv4 account
Grafana communicates with Uptrends through the API (version 4 - see the API documentation for more information), by requesting the relevant information and then displaying it in your Grafana dashboards. In order to make those requests, Grafana must have access to a registered API account. You can create an API account by following the instructions in the article Operator API account management.
The result of the steps outlined in that article is a username and password. Make sure to note these down, since you’ll need to add them to the data source in Grafana later on.
An API account is tied to an operator in Uptrends. Please ensure that the operator has at least the View monitor data in group permission for each of the monitors or monitor groups you wish to display in Grafana.
Installing the plugin
-
Extract the .zip and copy its contents to the Grafana plugin directory — the default location for the plugin directory is
/var/lib/grafana/plugins. For more information, refer to the Grafana documentation. -
Enable the plugin — the plugin is currently unsigned, which means that it must be enabled explicitly within the Grafana configuration. To enable the plugin, do the following:
- On the server that hosts your Grafana instance, locate grafana.ini (the default location is
/etc/grafana/grafana.ini) and open the file with your preferred file editor. - Under
[plugins](you may have to scroll down quite far or use a search function), locate keyallow_loading_unsigned_plugins. - Add the value
uptrends-uptrends-pluginto the commandallow_loading_unsigned_plugins.
- On the server that hosts your Grafana instance, locate grafana.ini (the default location is

- Restart Grafana — the plugin should now be available for use in the Grafana interface.
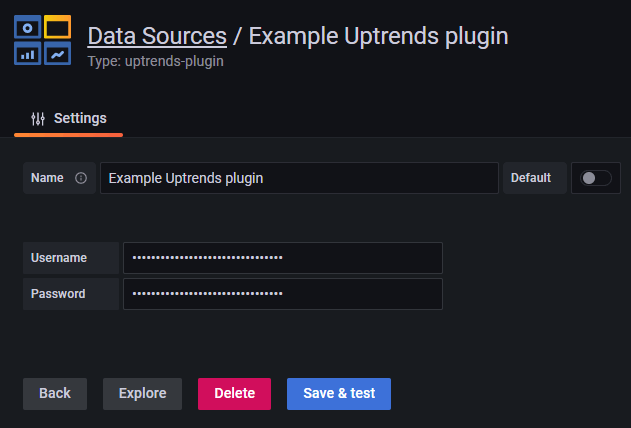
Creating the data source
- In your Grafana interface, go to Configuration (the gear icon in the left-hand menu) -> Data sources.
- Click Add data source.
- Filter on Uptrends and click on the resulting plugin (it should be called
uptrends-plugin). - Enter the APIv4 username and password generated in the first step of this guide, or use an existing set of credentials.
- Click Save and test.
Create a dashboard
Now that the data source has been set up, it can start pulling data from Uptrends and populating Grafana dashboards with this data.
- Go to Dashboards > + New dashboard, or edit an existing dashboard.
- Click Add a new panel.
-
Ensure that the correct data source (called
uptrends-plugin) is selected as the panel’s Data source. -
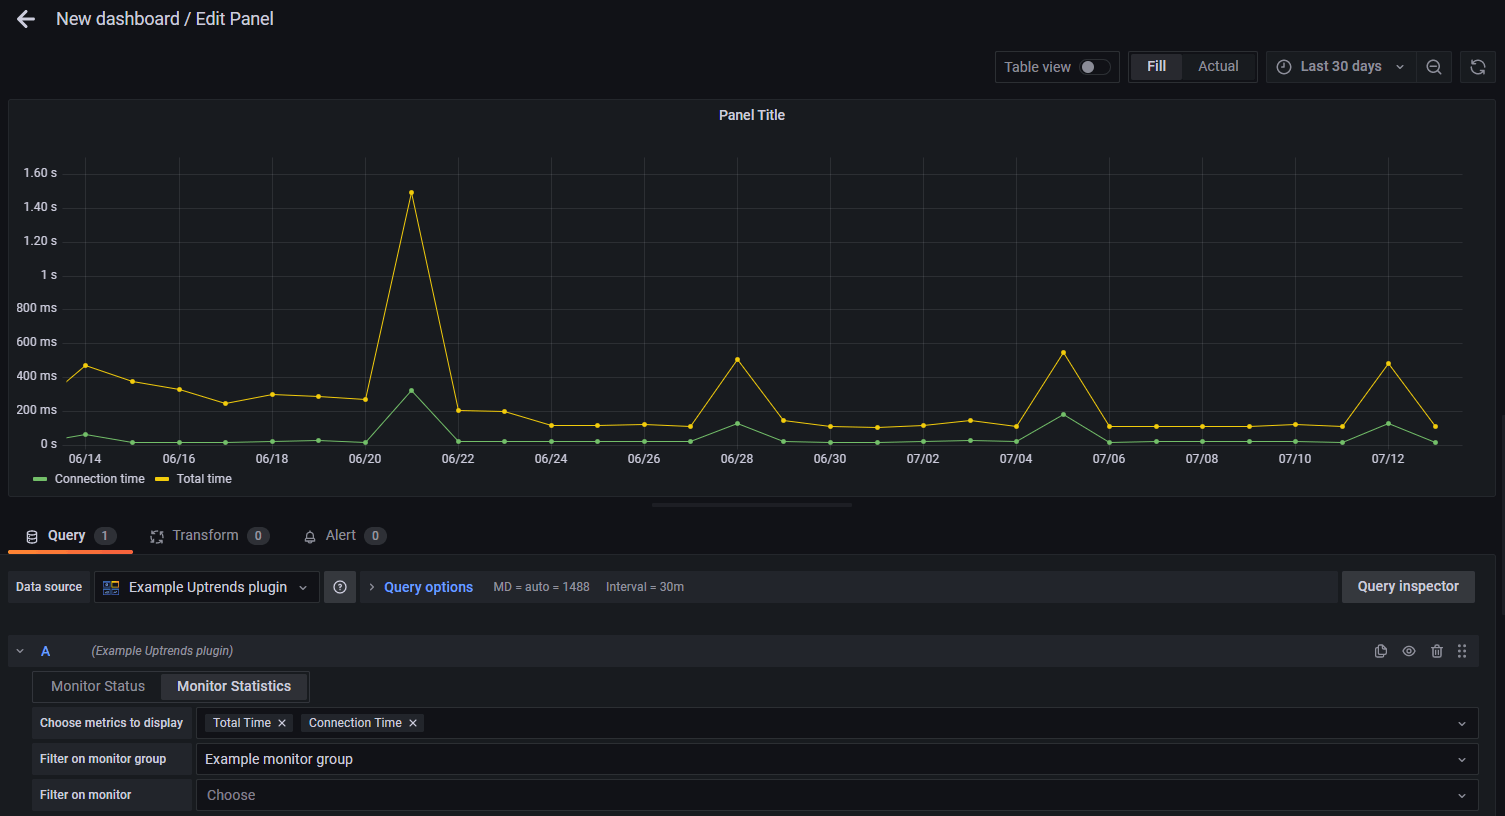
Choose a panel type in the top right corner, and fill out any further options as required in the right-hand menu.
-
Choose the data you wish to display.
-
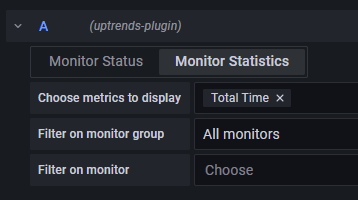
You can choose between either monitor status data (relating to your monitors' current error/ok status), or monitor statistics (related to monitor performance over time).
-
You can filter on a specific monitor or monitor group per query you add. The lists of monitors and monitors groups should automatically populate.
-
- Click Apply in the top right corner.
The guide above is a very basic description of getting Uptrends data into Grafana. As a full product, Grafana supports many additional options.