
When defining error conditions for your monitors, you have the option to set load or running time limits. You can enter two limits: a lower limit for when the duration becomes a concern and a higher limit for when the duration becomes critical.
The running time limit is used for transaction monitors and monitors not based on HTTP(S) or a browser, such as DNS, Ping, or mail server monitors.
The load time is used for HTTP(S), webservice HTTP(S), and Full Page Check monitors. It looks at the amount of time the check took from initial request until the check is complete.
While other error conditions always generate an error when the condition is met, the page load time can be set up to generate an error or just indicate the situation by showing a color code on the Monitor status dashboard. Keep in mind that if you want to use the alerting functionality you need to generate errors from this error condition.
Adding a check for total running time
To add a new check for running times:
- Go to .
- Click on the monitor’s name to edit it.
- Open the Error conditions tab and expand the Check total running time section.
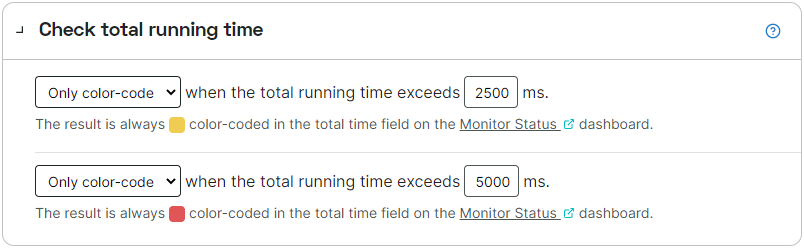
- Choose if you want to use only color-coding (Monitor status dashboard) or to generate an error.
- Fill in the values (in milliseconds) for the lower (concern) and higher (critical) running times.
- Click the button to save all changes in the monitor.
When used for a transaction monitor, the total running time total is the time it takes to complete the entire transaction.
Adding a check for load times
To add a new check for the load times:
- Go to .
- Click on the monitor’s name to edit it.
- Open the Error conditions tab and expand the Check page load time section.
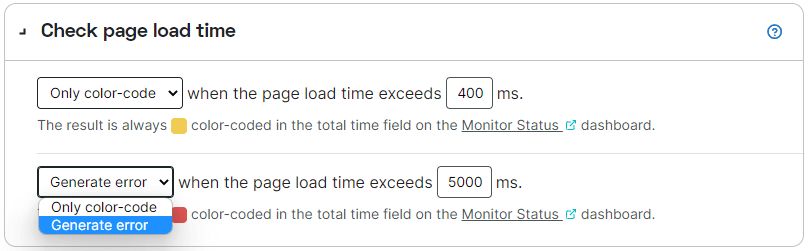
- Choose if you want to use only color-coding (Monitor status dashboard) or to generate an error.
- Fill in the values (in milliseconds) for the lower (concern) and higher (critical) load time limits.
- Click the button to save all changes in the monitor.
Only color-code
If you have chosen the option Only color-code for one or both time limits, the Monitor status dashboard will indicate that the time limits were reached. If the lower limit (concern threshold) is exceeded, the value appears with a yellow background in the Total time column, and when the higher limit (critical threshold) is exceeded, the time appears with a red background. You can open the Monitor status dashboard by going to the menu .
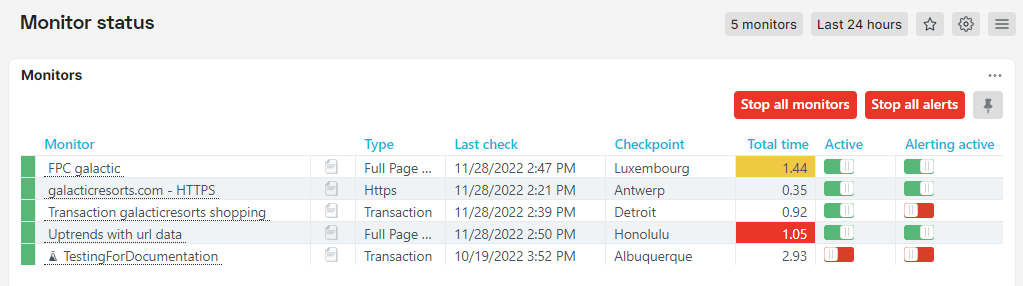
You will notice that in the Monitor status dashboard above there are two monitors that show a total time in yellow and red, but the error indicator on the left still appears green for successful tests. This is the result of using the option Only color-code.
Generate error
If you want to generate alerts based on the page load or running times, you have to use the option Generate error in the error condition. Only when errors are being generated, alerts can be generated subsequently. The knowledge base article Alerting overview explains in details how the sequence from monitor checks to alerts is working.
When choosing the Generate error option you still get the color coding of the load or running times on the Monitor status dashboard.