
Overview
You can choose how load times are measured for your browser and transaction monitors. In the monitor’s advanced settings, you can select either the W3C load event or Network time as your load time metric. These metrics display the Load time value on the Check details page, right next to the monitor type. For more details, see Load times.
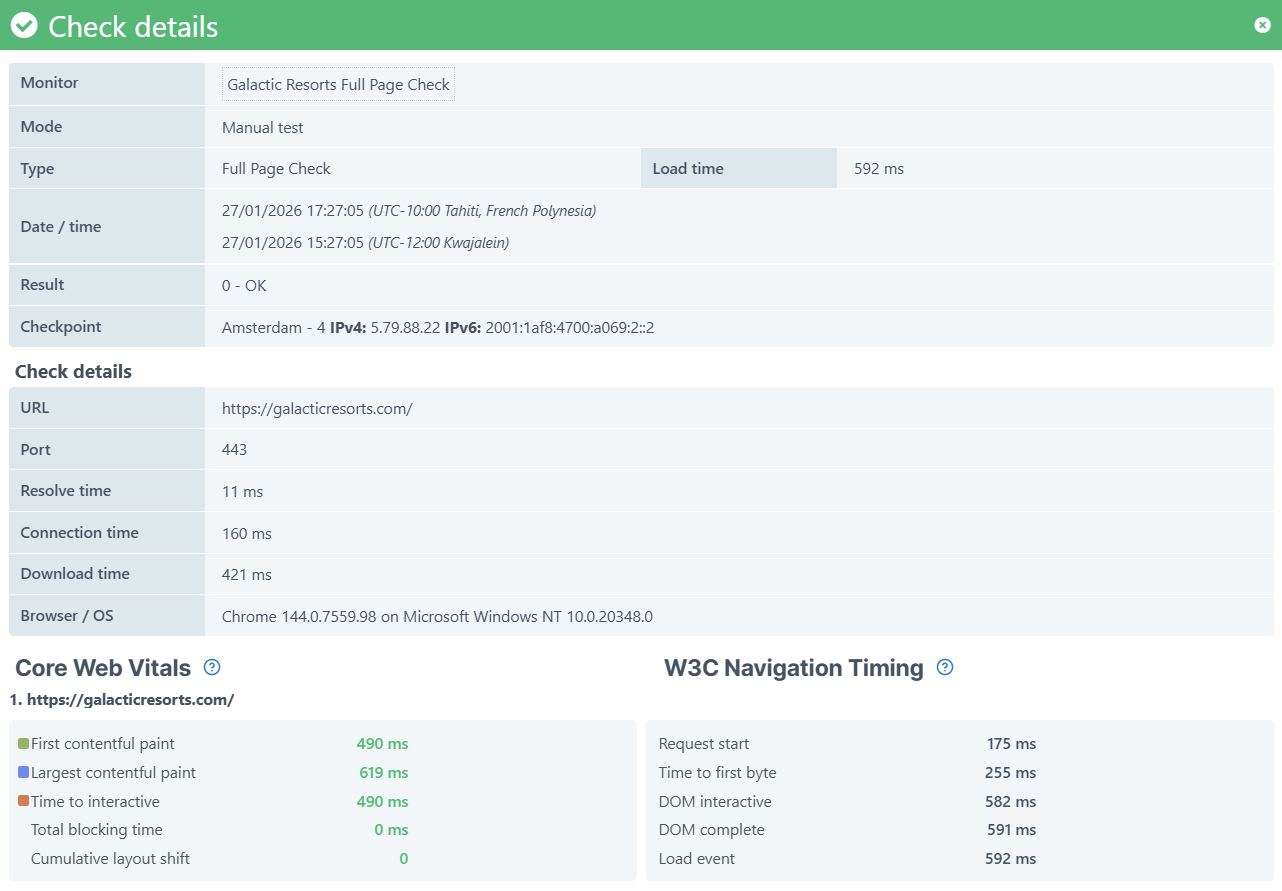
Browser monitor load times
When you use the W3C load event setting, the Load time matches the Load event value you see under W3C Navigation Timings. Both rely on the same standard measurement defined by the W3C load event.
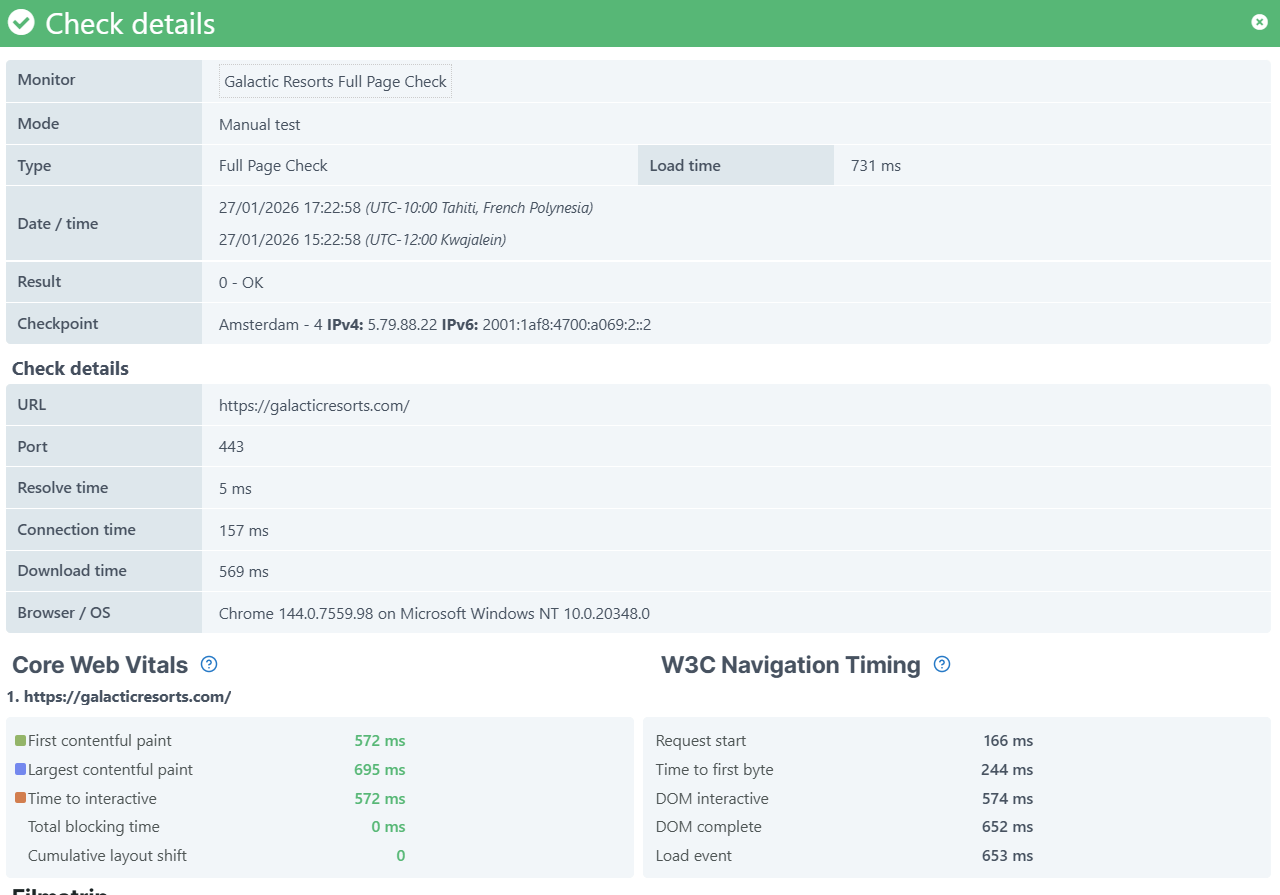
If you switch to Network time instead, the calculation works differently. Network time is measured when network activity stops (network idle time), not when the browser fires its load event. Since it waits for all network traffic to finish, you see higher load times, especially when network conditions are slower.
Transaction monitor load times
For transaction monitors, the load time represents the total of the load times from each individual step in the transaction.
When you use the W3C load event setting, the load time is based on the W3C load event of every transaction step:
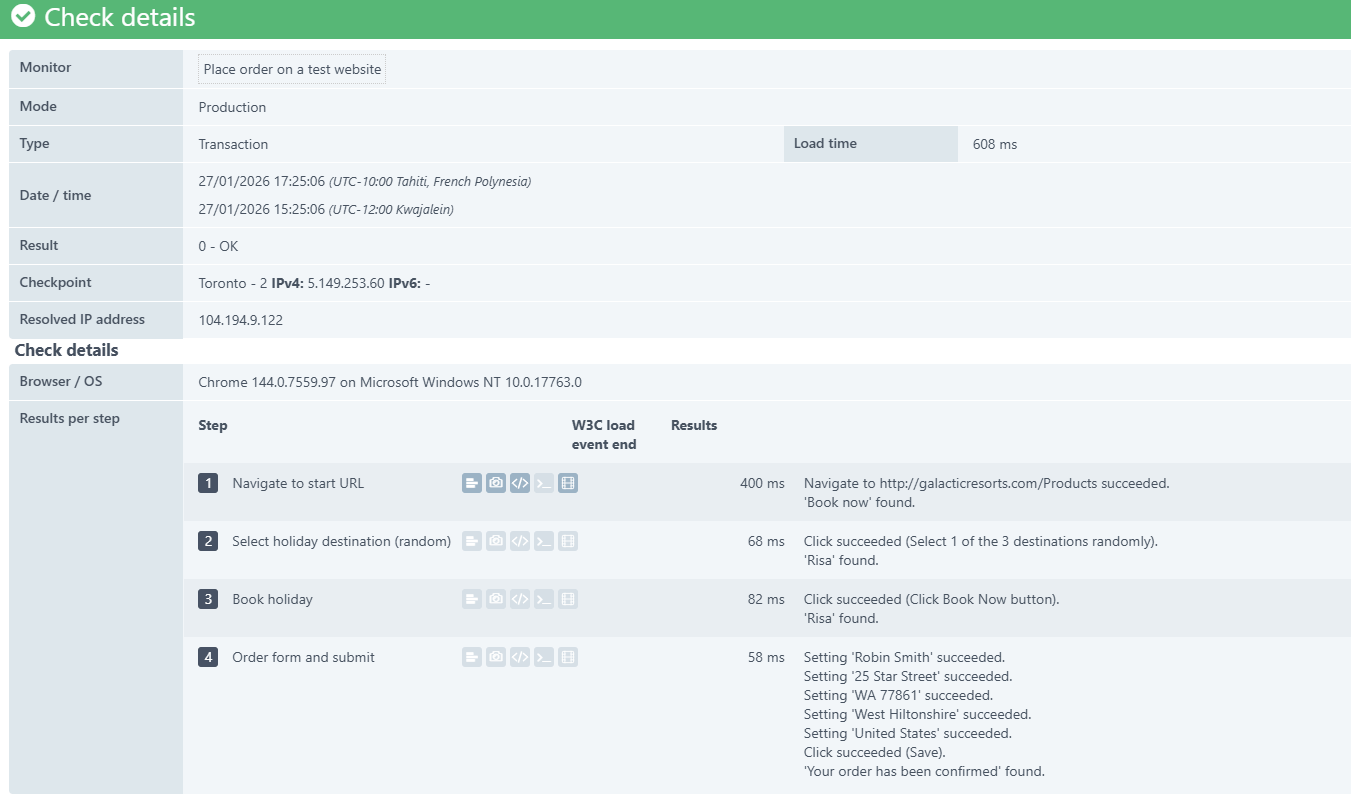
In this example, the total load time is 608 ms. This is calculated by adding up the W3C load event time for each step:
- Step 1: Navigate to start URL = 400 ms
- Step 2: Select holiday destination (random) = 68 ms
- Step 3: Book holiday = 82 ms
- Step 4: Order form and submit = 58 ms
Total: 400 + 68 + 82 + 58 = 608 ms
When you use Network time, the calculation is similar, but it uses network idle time instead of the browser’s load event for each step:
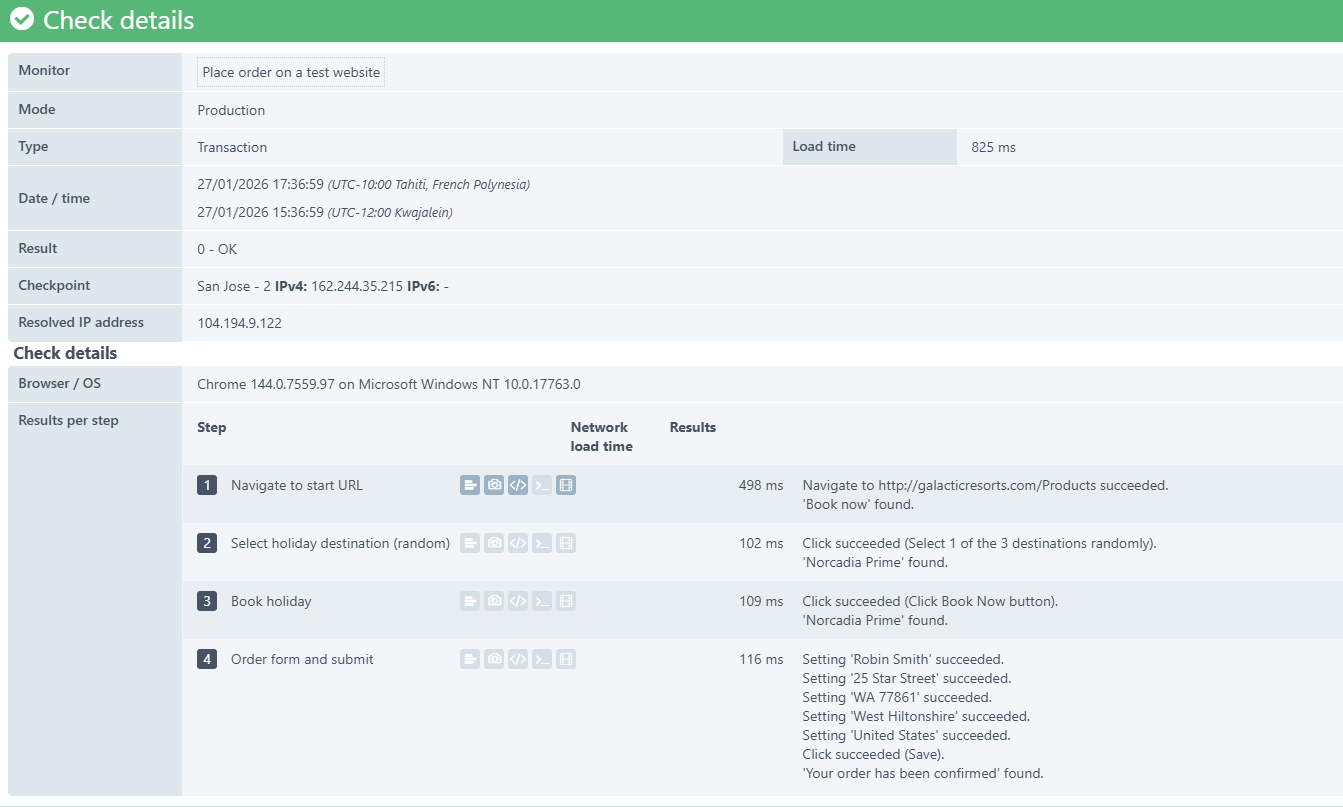
In this example, the total load time is 825 ms. This is calculated by adding up the load time for each step:
- Step 1: Navigate to start URL = 498 ms
- Step 2: Select holiday destination (random) = 102 ms
- Step 3: Book holiday = 109 ms
- Step 4: Order form and submit = 116 ms
Total: 498 + 102 + 109 + 116 = 825 ms
Since network time waits for all network activity to finish, you see higher load times, especially when network conditions are slower.