
For transaction monitors and Full Page Check monitors, you have the option to view the page source (meaning the HTML document as received by the checkpoint), as well as the console log that was generated when we loaded the page.
In Full Page Checks
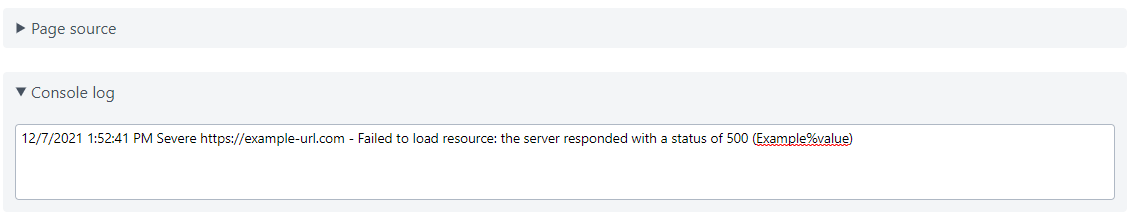
For Full Page Checks (FPCs), the page source information and the console log can be found in each monitor result, beneath the waterfall chart. You’ll always get the page source information, but the console log will only be available if there were actual console log entries in the browser when the page was loaded. Typically, the browser will generate console log entries when something goes wrong - for example, if a certain element cannot be loaded correctly, or if a javascript error is encountered.
In transaction monitors
For transaction monitors, the page source and console log option will need to be explicitly enabled.
Setting up page source and console log capture in a transaction
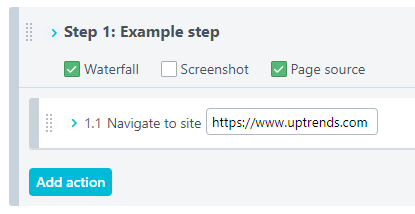
In order to view page source and console log data for a specific step in a transaction, you must first enable the Waterfall option for that step (see our guide on working with transaction waterfalls). Then, the Page source option will become available. Selecting this option means monitor check results will contain both the page source information and any console log data that may have been generated during the execution of that step.
Locating the page source and console log info in a transaction
After you’ve enabled the page source option for a transaction step, you can find the information in your monitor check results generated after that point. Locate the transaction in your Monitor log or navigate to the transaction dashboard, and click any monitor check result generated after you enabled the Page source option.
![]()
To open the page source information for this particular step, click the third icon in the monitor check result. You can find the console log by clicking the last icon , but this may not always be available.