Real User Monitoring (RUM) is about the aggregated users' experience; therefore, RUM reporting calculates the results based on all of your users. Understanding how Uptrends calculates the results is important because you want to know that the data in your RUM reports is truly representative of your users' experience. By default, your RUM reports use the median values over the average (mean), but you can always switch between the two methods. So that you make the best choice for your reports, this article compares the two methods, explains how Uptrends calculates the median values, and why we think data sampling is not a good choice when it comes to your RUM data.
Average vs. Median
When looking at your RUM tables and charts, you’ll notice that by default we report median values instead of averages. We use the median value because we feel that the median is more representative of the data set. Let’s take a second to review the two methods.
Average: The sum of all numbers divided by the quantity. For example, the average for the set {1, 2, 2, 3, 12} is 4.
Median: The middle number in a set. For example, the median value for the set {1, 2, 2, 3, 12} is 2.
As you can see in the above examples, the outlier 12 distorts the average value while the median value represents the data set more accurately. Calculations using the median value capture the center mass without the distortion brought on by unusually low or high values within the set.
How Uptrends calculates the median
In a relatively small data set, Uptrends calculates the median by sorting the data set and using the middle value, but larger data sets cause problems when calculating the median value. Finding the middle values in large data sets takes a lot of time, so rather than make you wait, we calculate the median value using a histogram. The histogram approach speeds up the calculation, but it does introduce a low standard deviation of about 1%. Even with the potential 1% deviation rate, we feel the median calculation using a histogram still surpasses the average in accurately describing your users' experiences.
The sampling alternative to histograms
An alternative approach to histograms is data sampling. With data sampling, the calculation only uses a subset of the data for establishing the average or median value. RUM allows you to group your data based on your users' location, browser and version, operating system and version, device type, and page viewed. With data sampling, you can lose entire user groups. With Uptrends, we want you to see your results based on all of your users, but as we explained earlier, calculating your results takes time. With the histogram approach, you get your results fast without the loss of users in your data set.
Switch between median or average values
You can designate which calculation method you use for your reports.
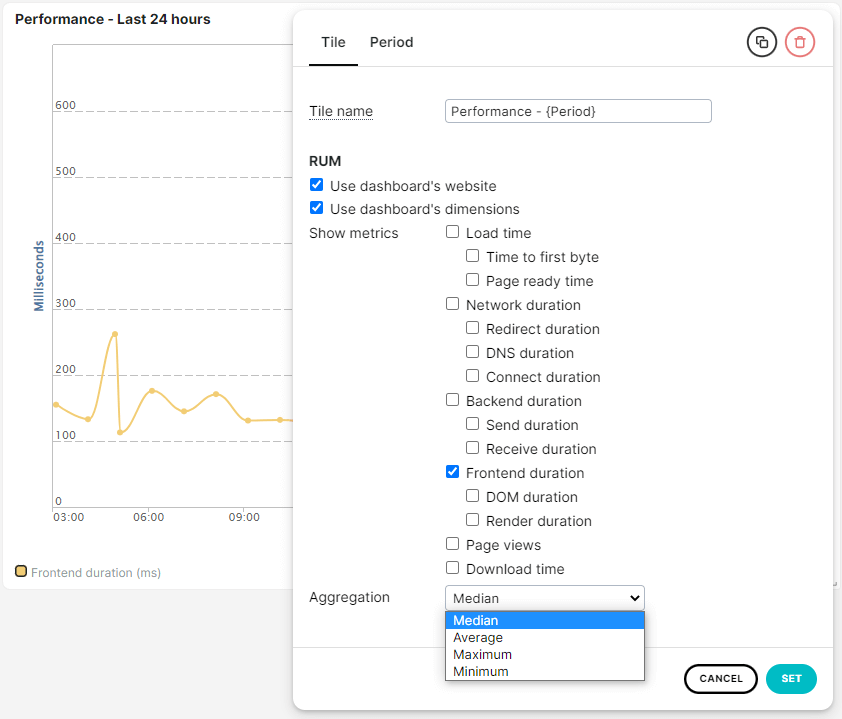
- Go to the RUM dashboard tile that you want to change.
- Open the three-dot menu to access the tile settings.
- Select an option from the Aggregation list.
- Click Set.