
API hub provides a general overview of your API monitor setup, including multi-step API and postman monitors. To open this page, go to Explore API monitoring menu. In the sidebar menu, you’ll find links to relevant knowledge base articles:
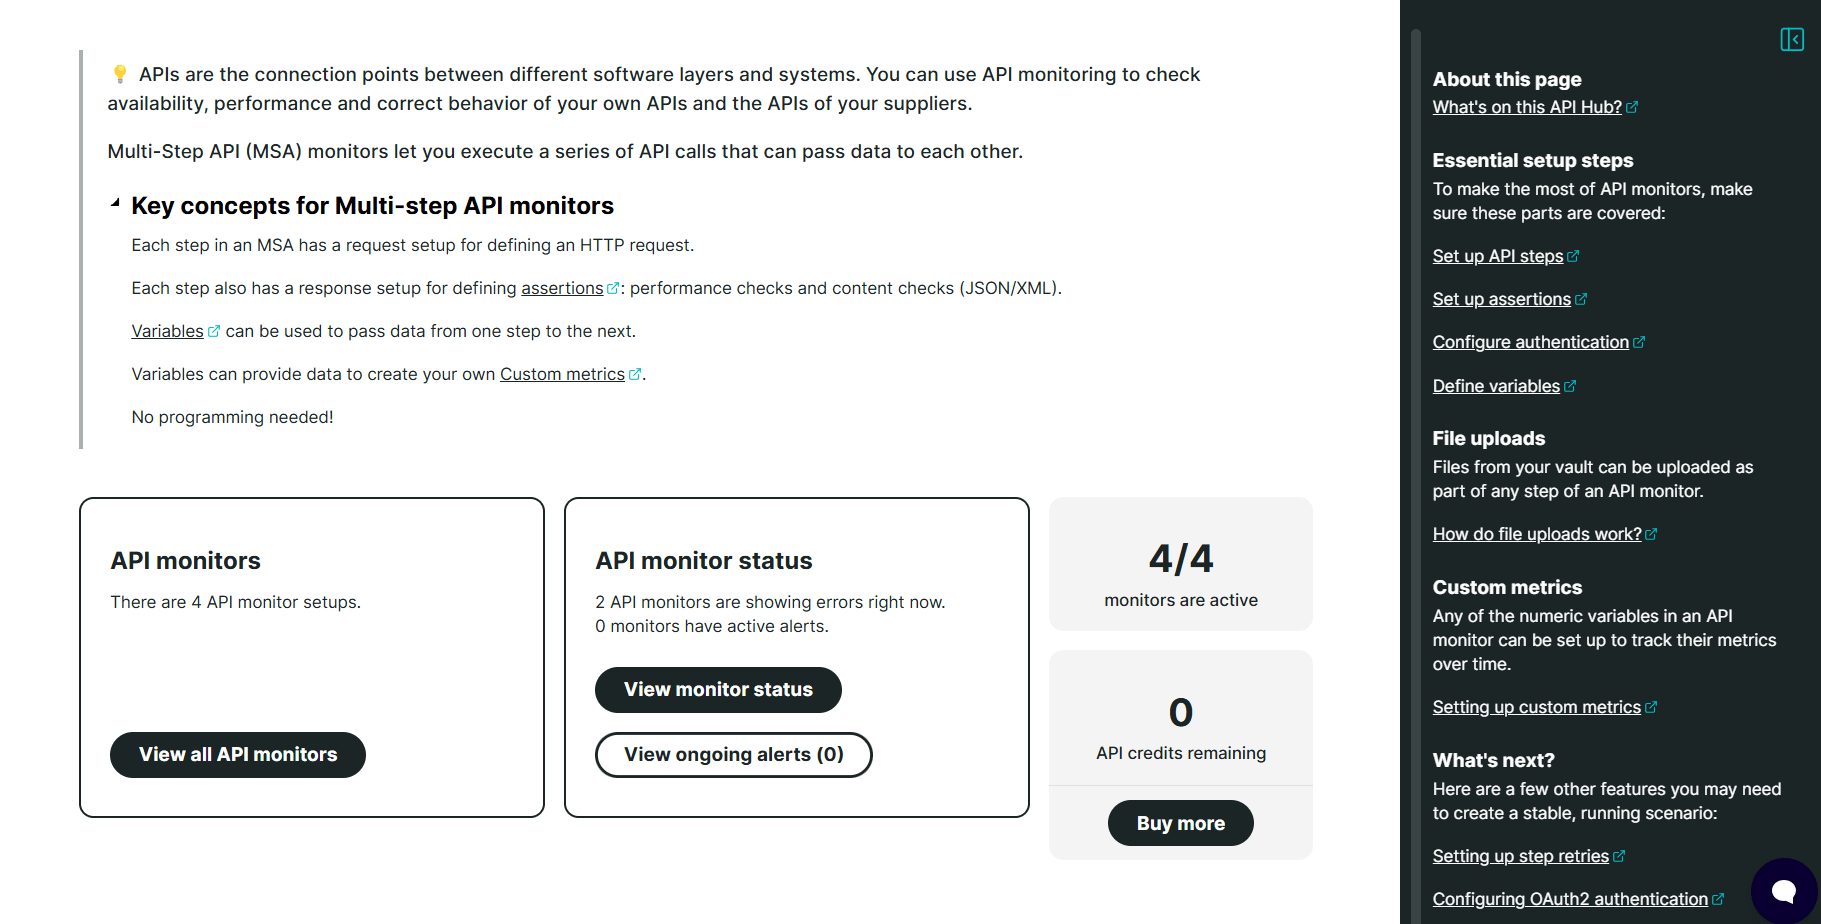
The following cards display your API monitor setup:
-
API monitors shows the number of your monitor setups. Clicking View all API monitors opens the API monitors overview or the API monitors setup menu.
-
API monitor status shows the number of monitors with confirmed errors and active alerts. Clicking View monitor status opens the Monitors status page. Clicking View ongoing alerts opens the Current alert status page.
-
Active monitors shows the API monitors in Staging and Production mode.
-
API credits shows your API credit balance. To know more about credits, refer to Adding extra monitors and credits.
The hub also features a way to automatically scan your existing monitors and identify those that can be converted into API monitors. If it detects any HTTP or HTTPS monitors that appear to check an API endpoint, it will offer the option to automatically create a new API monitor for you.
This functionality instantly upgrades any Uptime monitor into a fully configured API monitor without deleting or modifying the original monitor. You can freely undo the action at any time if needed. Additionally, there’s no need to manually recreate everything from scratch, Uptrends handles all the setup, replicating the same settings from your existing monitors.
Clicking See details opens a pop-up that lets you convert your existing monitor into an API monitor. Once converted, another pop-up will appear to let you review the configuration and enable the newly created monitor for use.