
If you’re new to Uptrends monitoring, we recommend that you read the Uptrends Basics article for an overview of its key monitoring features and core functions.
Uptrends offers a wide range of monitor types that check the availability and measure the performance of your websites, APIs, and other web services. When a monitor runs tests from different checkpoint locations, it gets monitor results to inform you about the load time, status code, date and time of when the check was executed, and more. These results are key metrics that provide insight on the reliability and performance of your services.
This article describes the different monitoring results you’ll see depending on the monitor type and its configuration.
Monitor results based on the monitor type
| Monitor type | Monitor results available |
|---|---|
| Uptime | |
| Browser (Full-Page Check) | |
| Multi-step API (MSA) | |
| Postman API | |
| Transaction (User journey) |
Monitor results
Monitor results are collected and generated when a monitor runs tests. They can serve as a starting point for troubleshooting or as a basis for your monitoring data. Monitor results can be found in the following locations:
- From the monitor editor screen, click Test now to show the current status of a monitor check.
- Go to . Select a row in the Confirmed and Unconfirmed log dashboard tile to view monitor results from an individual check.
- Go to . Select a row to view monitor results from an individual check.
- You can further view other monitor results from Uptrends Pre-defined dashboards or Create your own customized dashboards.
Below is a list of the available monitor results.
Check details
The Check details contain general monitoring information and results based on the monitor type and its settings. You’ll see this screen when you run a monitor using the Test now or when you go to a dashboard to view an individual check.
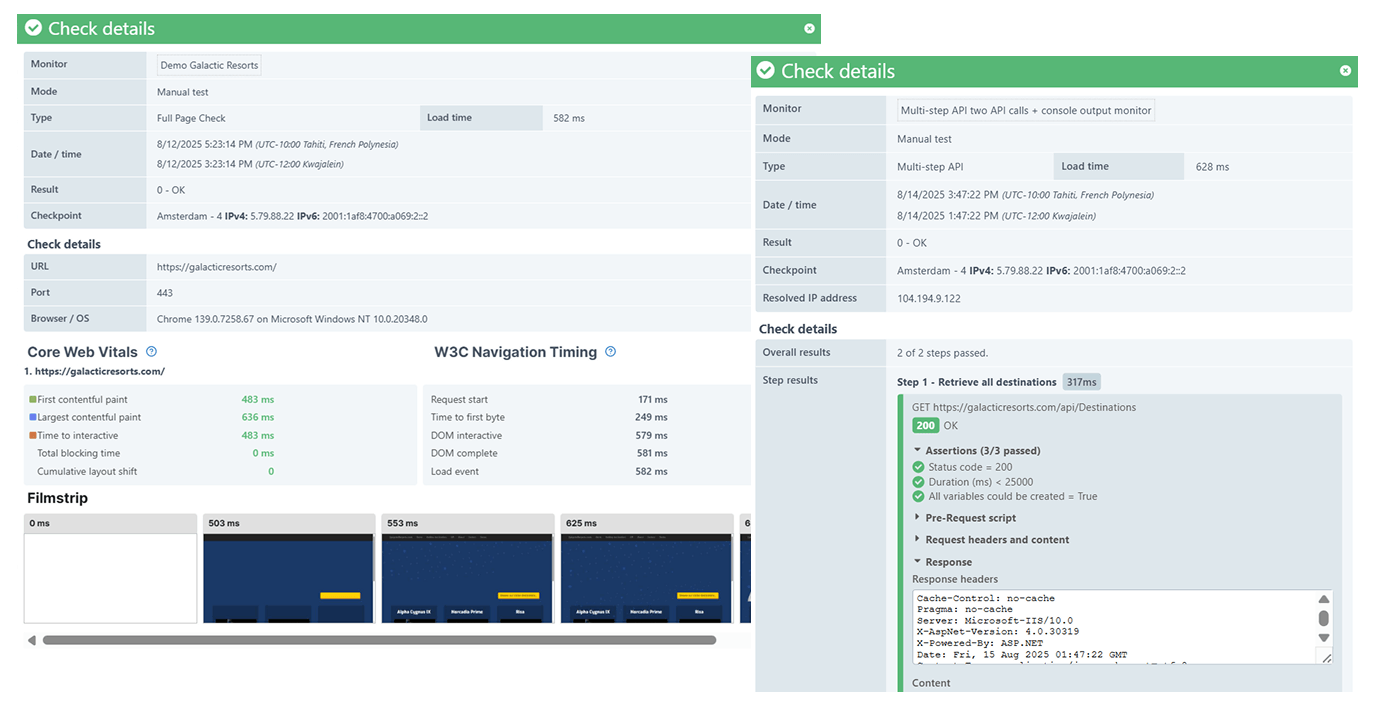
The Check details shows you basic monitor results, such as the URL you monitored, checkpoint location used, date and time of when the check was executed, and more. Depending on the monitor type, it may also include information, such as the API behavior, Core Web Vitals metrics, W3C Navigation Timing metrics, Filmstrip (Timeline screenshots), Waterfall, Page source, and Console log results.
For more information, refer to the Check details article.
Core Web Vitals
Core Web Vitals are a set of key metrics defined by Google to measure the performance of your websites and identify improvements to score higher in search engine rankings. These metrics include the First Contentful Paint (FCP), Largest Contentful Paint, and others. These metrics lets you measure the different aspects of user experience when visiting any site, such as loading speed and visual stability.
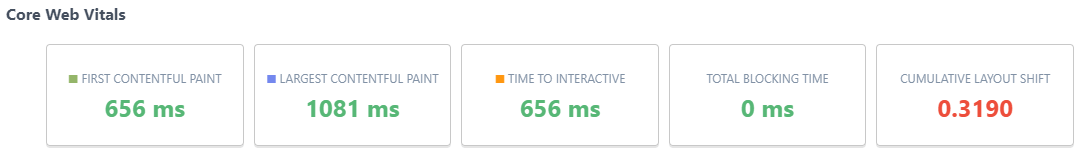
For more information, refer to the Core Web Vitals article.
W3C Navigation Timing
W3C Navigation Timing are a set of key metrics defined the World Wide Web Consortium (W3C), which is an international organization involved in developing standards for the world wide web. These metrics are standard measurements for browsers and web applications to generate and display timing information when loading webpages. These metrics lets you measure the load event, request start, DOM behaviors, and others.
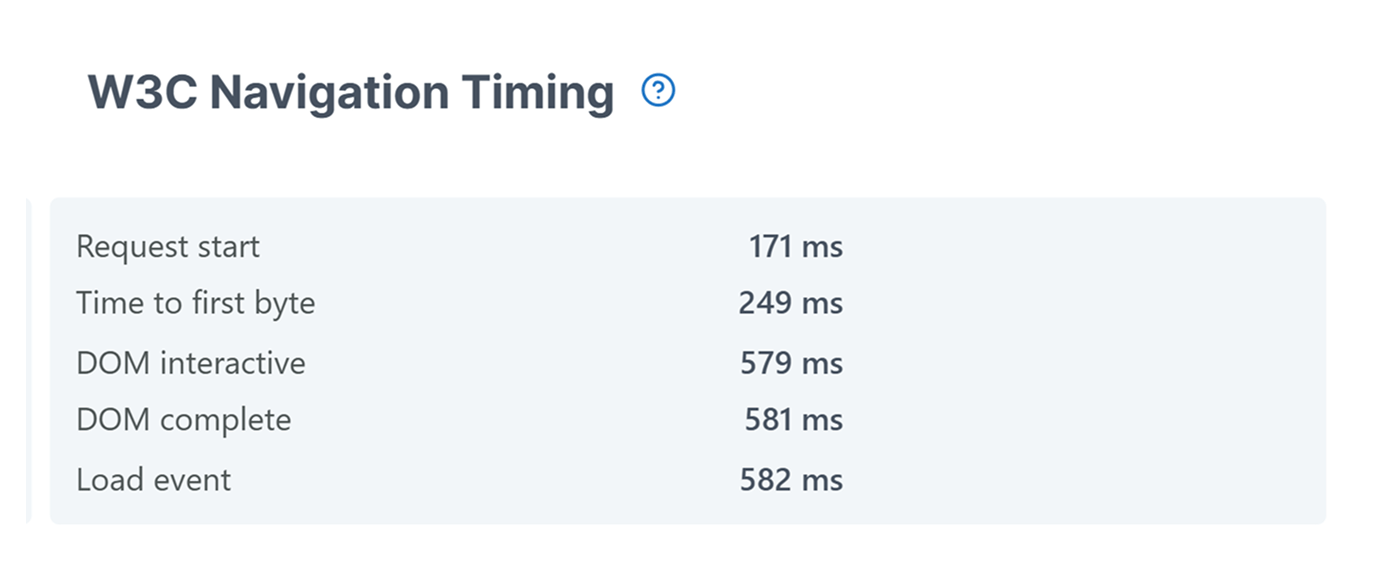
For more information, refer to the W3C Navigation Timing article.
Filmstrip (Timeline screenshots)
The Filmstrip, also known as timeline screenshots, are a sequence of screenshots from the browser, showing exactly what the page looked like at different points during its loading process. This lets you visualize page elements and resources to see whether they are displayed correctly and as expected. You can always check the results of the filmstrip together with the waterfall chart to see more detailed information of the page’s behavior.
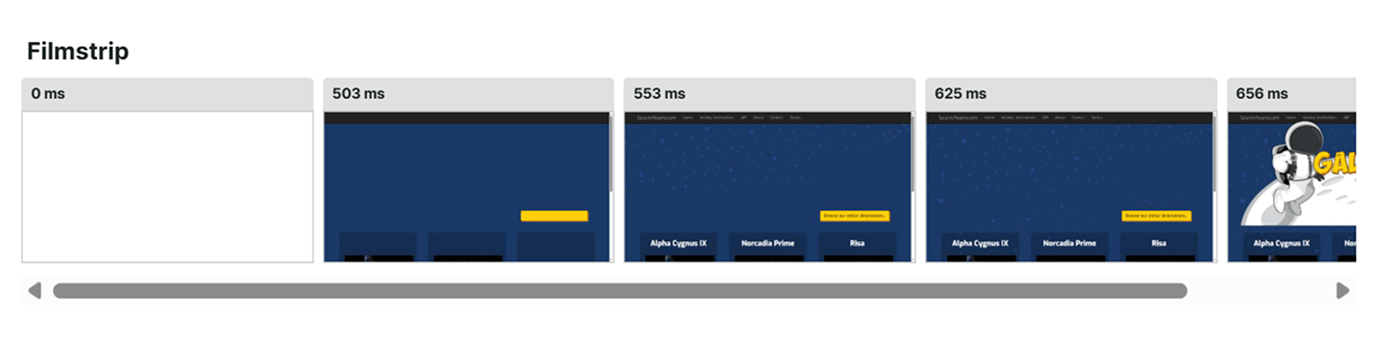
For more information, refer to the Filmstrip (Timeline screenshots) article.
Waterfall
The waterfall chart helps you visualize your monitoring results as a bar chart, showing detailed information of when and how long it takes for each page element to load. This is useful when you want to identify if there are broken images or what resources slow down a page’s loading.
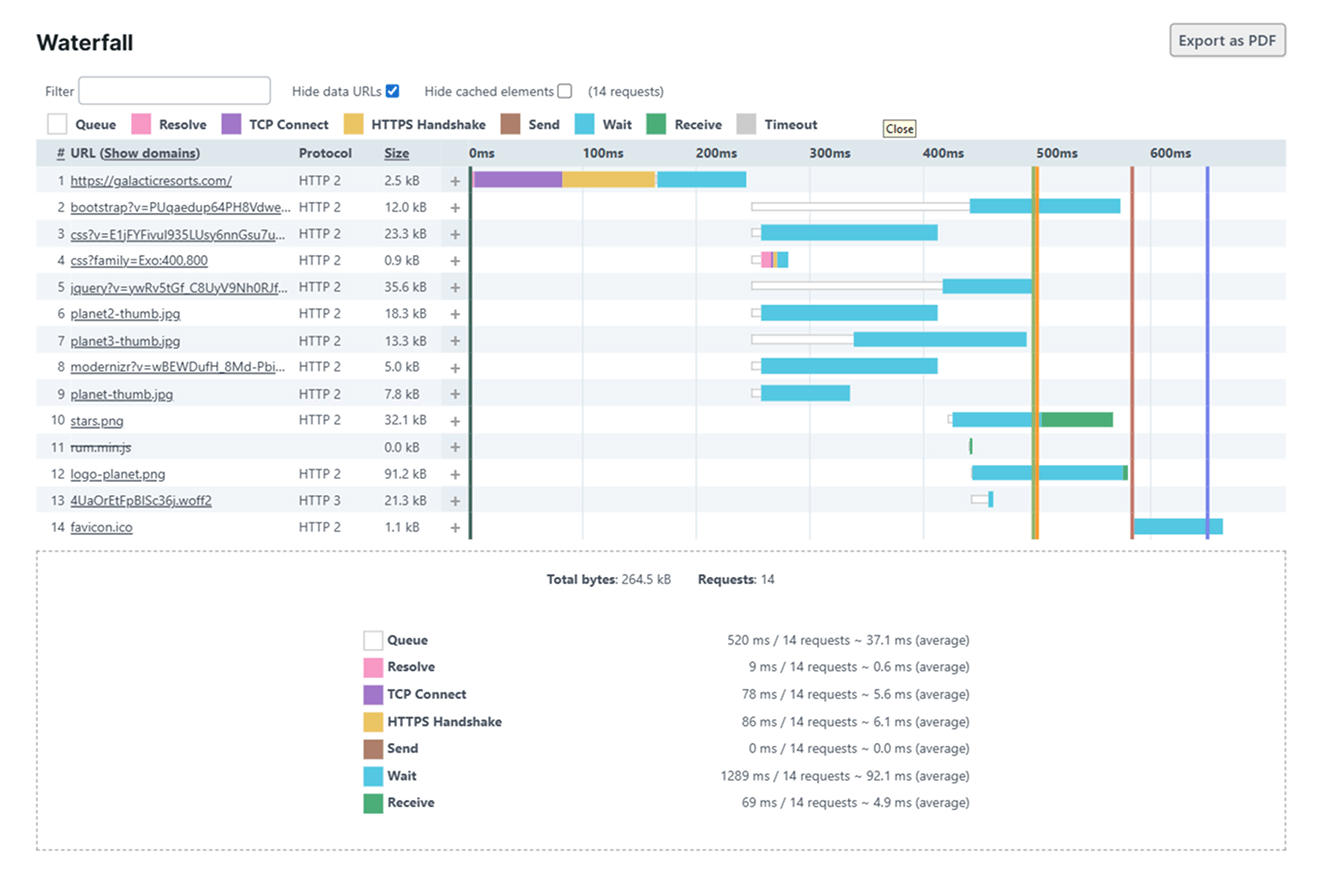
For more information, refer to the following knowledge base articles:
Page source
The Page source is the website’s raw structure in HTML format, including the page’s metadata, scripts, and styling information.
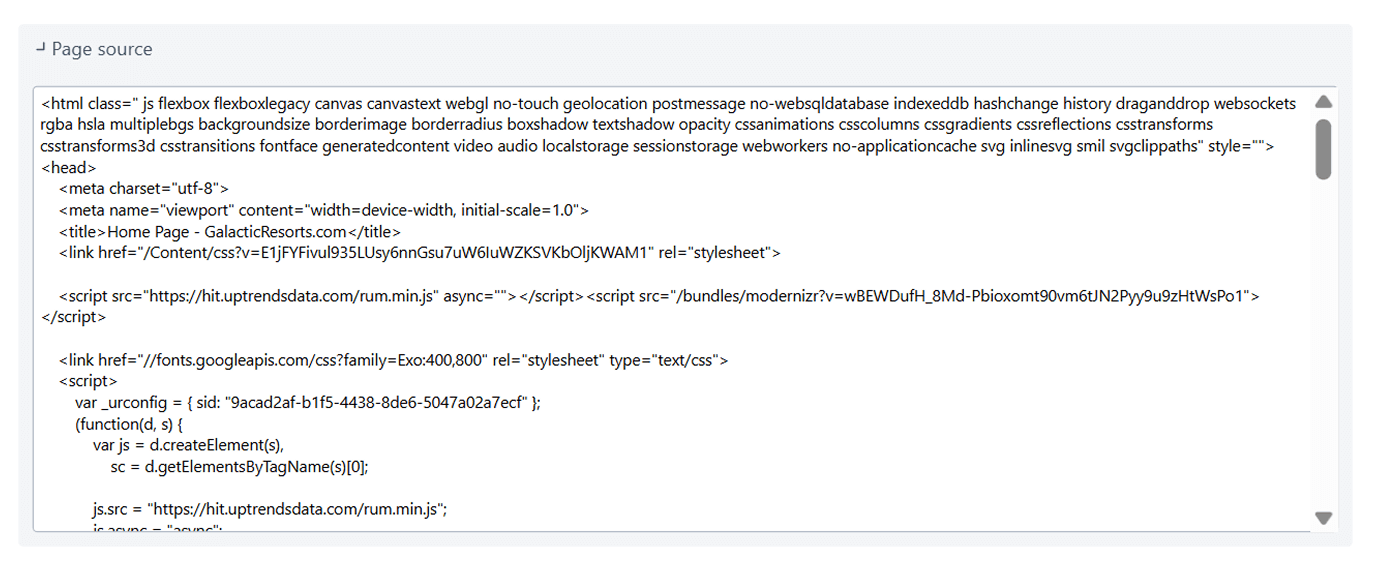
For more information, refer to the Page source article.
Console log
The console log shows you messages or debugging information. This will only be available if there are console log entries in the browser when the page was loaded.
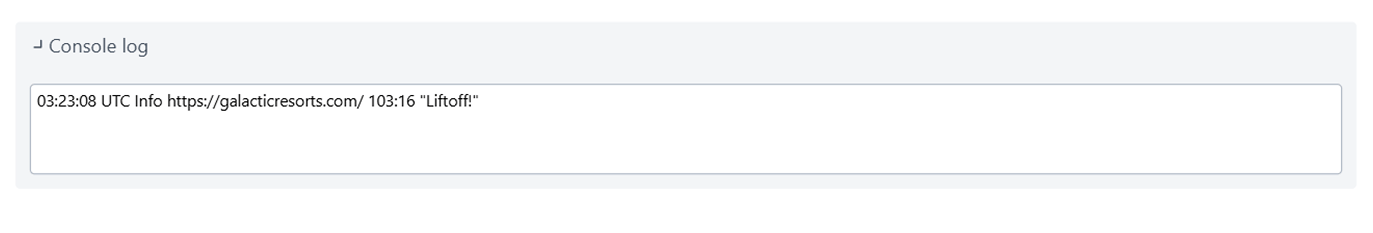
For more information, refer to the Console log article.
Troubleshooting
If you need assistance troubleshooting your monitor results, please reach out to our Support team.