If you’re new to Uptrends monitoring, we recommend reading the Introduction to Uptrends and Monitoring results overview articles to learn about monitoring fundamentals and its key features.
This article describes the Check details screen, the most common screen for viewing monitoring results in Uptrends.
Check details
When a monitor runs a check, the results are collected and shown on the Check details screen. This screen displays whether the check was successful (OK) or if an error occurred, based on the error conditions you configured. It also provides additional details about the check and its outcome, which can help you troubleshoot the root cause of any errors.
You can see the Check details screen in several ways:
-
From a monitor: Edit a monitor and click Test now to run a monitor check.
-
From dashboards: Go to any of the following dashboards and click on an individual error or check:
-
From custom dashboards: Add the Last check details dashboard tile to your custom dashboards.
Each option opens a popup with monitoring information.
What is included in the check details?
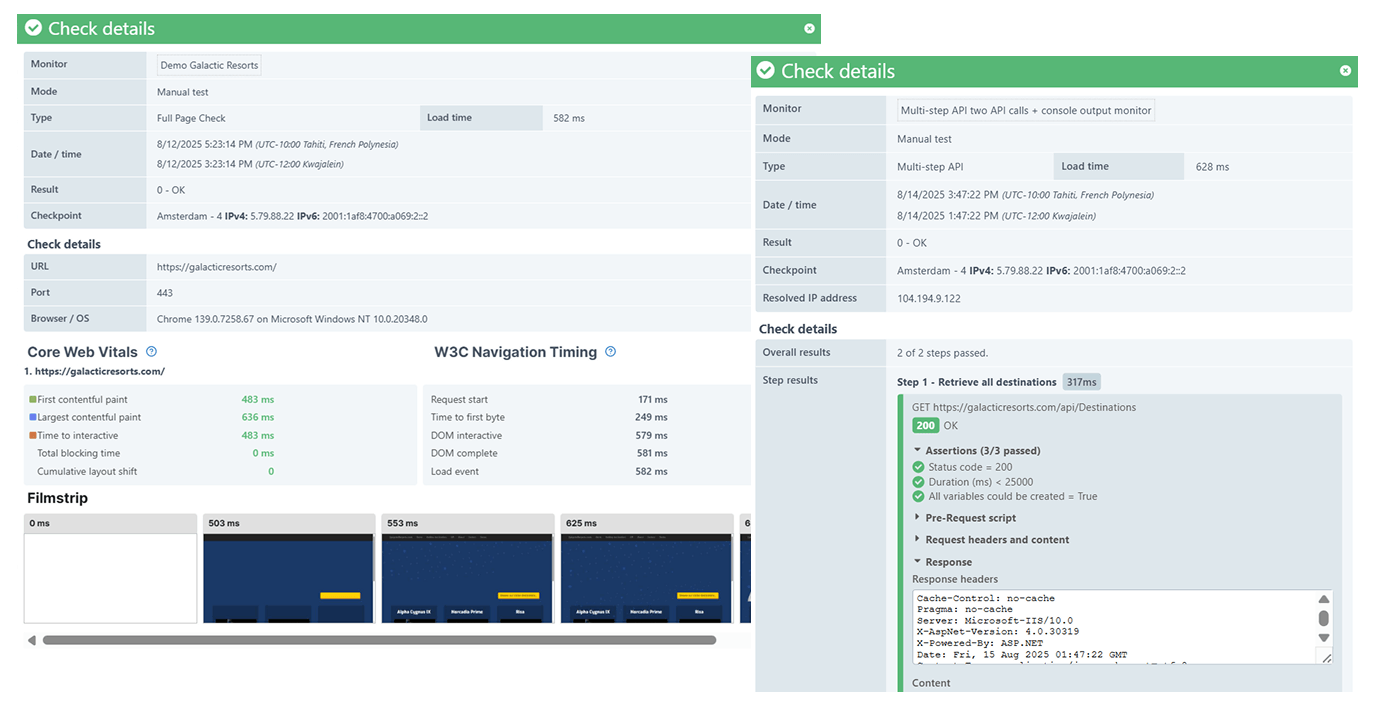
The Check details screen shows different information based on the monitor’s type and its configuration. For example, an HTTPS monitor may only display the status code, while more advanced monitors can include screenshots, waterfall charts, step results, and other details.
General information
Below are the general information available for all monitor types:
- Monitor name
- Monitor mode — shows for which environment the monitor check was performed. This can be a Manual test or Production.
- Monitor type — shows whether the monitor is of type HTTPS, Ping, DNS, Multi-step API, Postman API, Transaction, and others.
- Date and time of when the check was performed as well as the location of where it was executed.
- Result — shows 0 - OK if there are no errors, otherwise, you’ll see an error code showing the error description.
- Load time — the time it took for the test to run in milliseconds. Load times may depend on the monitor type. For more details, see Load times for browser and transaction monitors.
- Checkpoint location and its associated IPv4 and IPv6 addresses.
- Resolved IP address
- URL — the full URL of the website, page, or service that you are monitoring.
- Port number — the TCP port number used to establish a connection to the host name or IP address you specified.
- Status code — displays the HTTP response code returned by the server (for example, 200 for successful OK result and 404 for not found).
Uptime monitors
Below are the information available for uptime monitors:
- Total bytes — the total size of the page resources in bytes.
- Resolve time
- Download time
- Connection time
- SSL certificate information for SSL monitors.
- Page content — includes the response headers and the HTML content for HTTPS monitors.
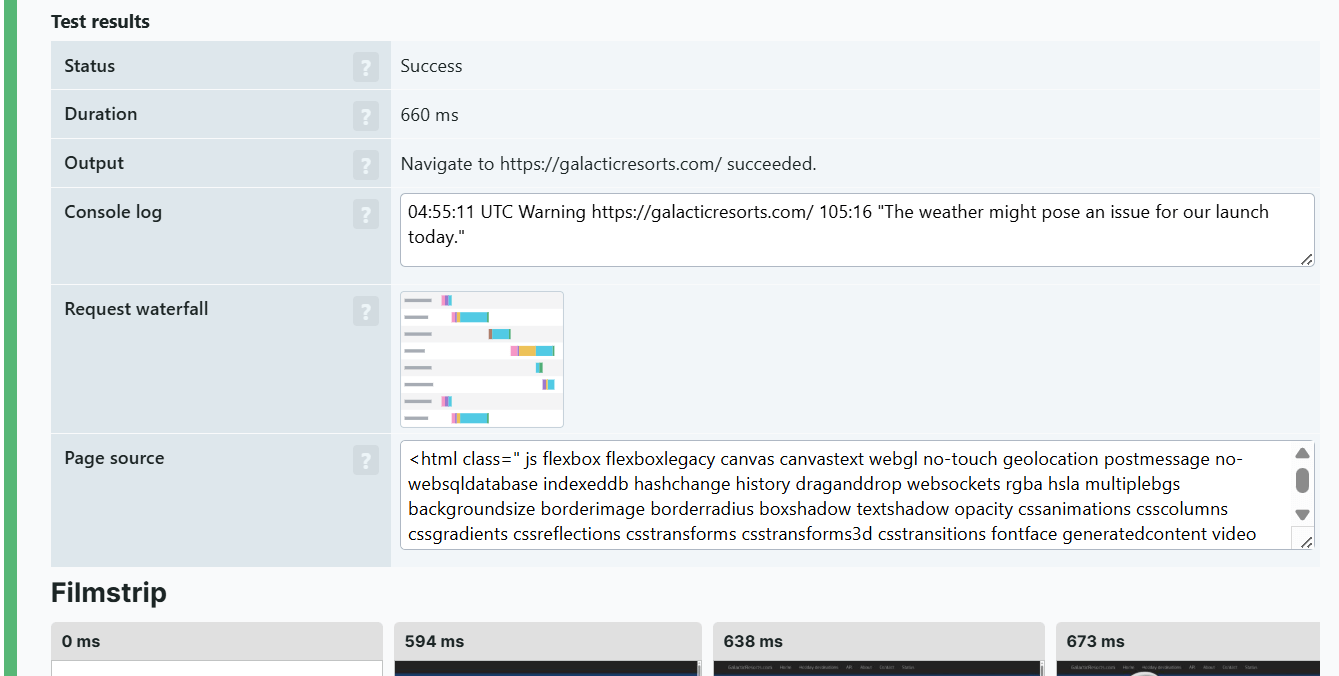
Browser monitors (Full Page checks)
Below are the information available for browser monitors:
- Browser and operating system information
- Core web vitals result
- W3C navigation result.
- Film strip (timeline screenshots)
- Waterfall chart
- Page source
- Console log
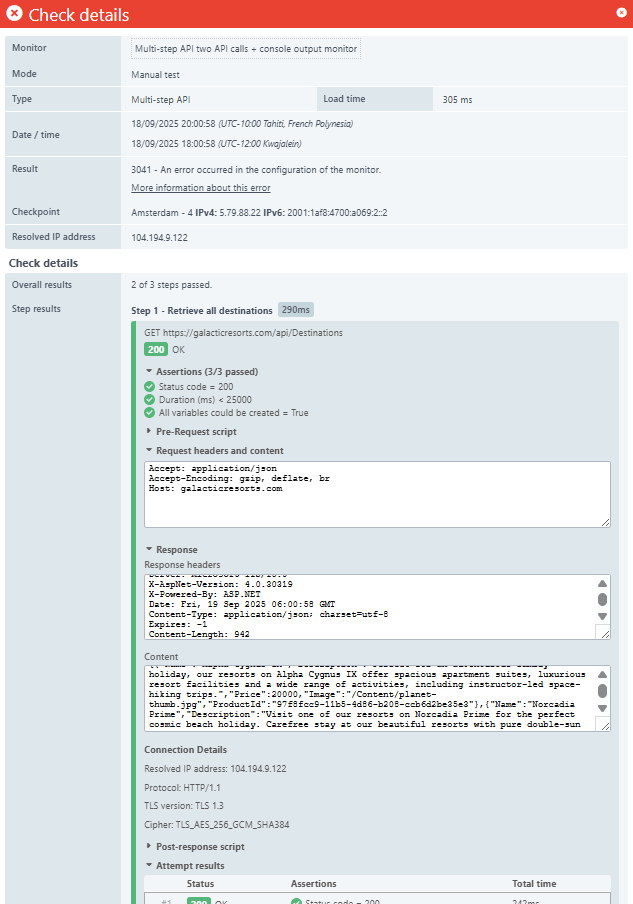
Multi-step API monitors
Multi-step API monitors provide detailed step-by-step results for each API call in your sequence. The check details include:
- Assertions — validation rules and their pass or fail status for each step.
- Pre-request script — output of the JavaScript codes or snippets executed before the API request.
- Request headers and content — the HTTP headers and body data sent to the API.
- Response headers and content — the HTTP headers and body data received from the API.
- Connection details — network timing information and connection statistics, such as HTTP and TLS versions used.
- Post-response script — output of the JavaScript codes or snippets executed after receiving the API response.
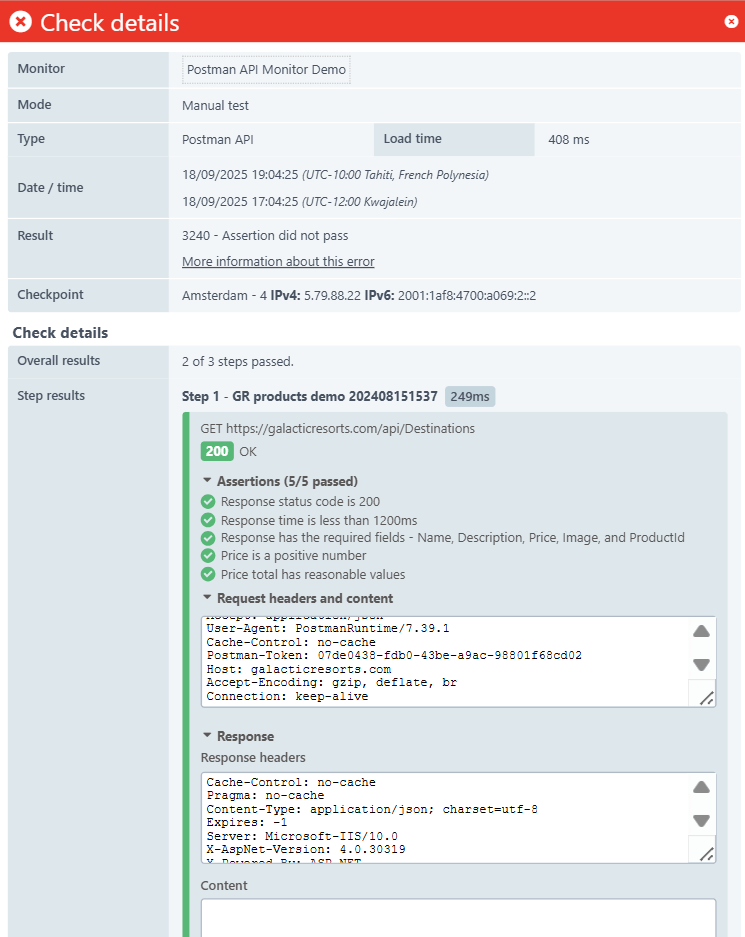
Postman API monitors
Similar to multi-step API monitors, postman API monitors provide detailed step-by-step results for each API call in your sequence. The check details include:
- Assertions — validation rules and their pass or fail status for each step.
- Request headers and content — the HTTP headers and body data sent to the API.
- Response headers and content — the HTTP headers and body data received from the API.
Transaction monitors
Below are the information available for transaction monitors:
- Browser and operating system information
- Status and output — displays the result of the step (success or failure).
- Load times
- Core web vitals result
- W3C navigation result
- Film strip (timeline screenshots)
- Waterfall chart
- Page source
- Console log