The data that is collected during monitoring can be viewed in the Transaction overview dashboard. As the name says already this is an overview and may contain information about several transaction monitors. If you are interested in the details for a specific transaction monitor, open the Check details of that monitor.
Transaction overview dashboard
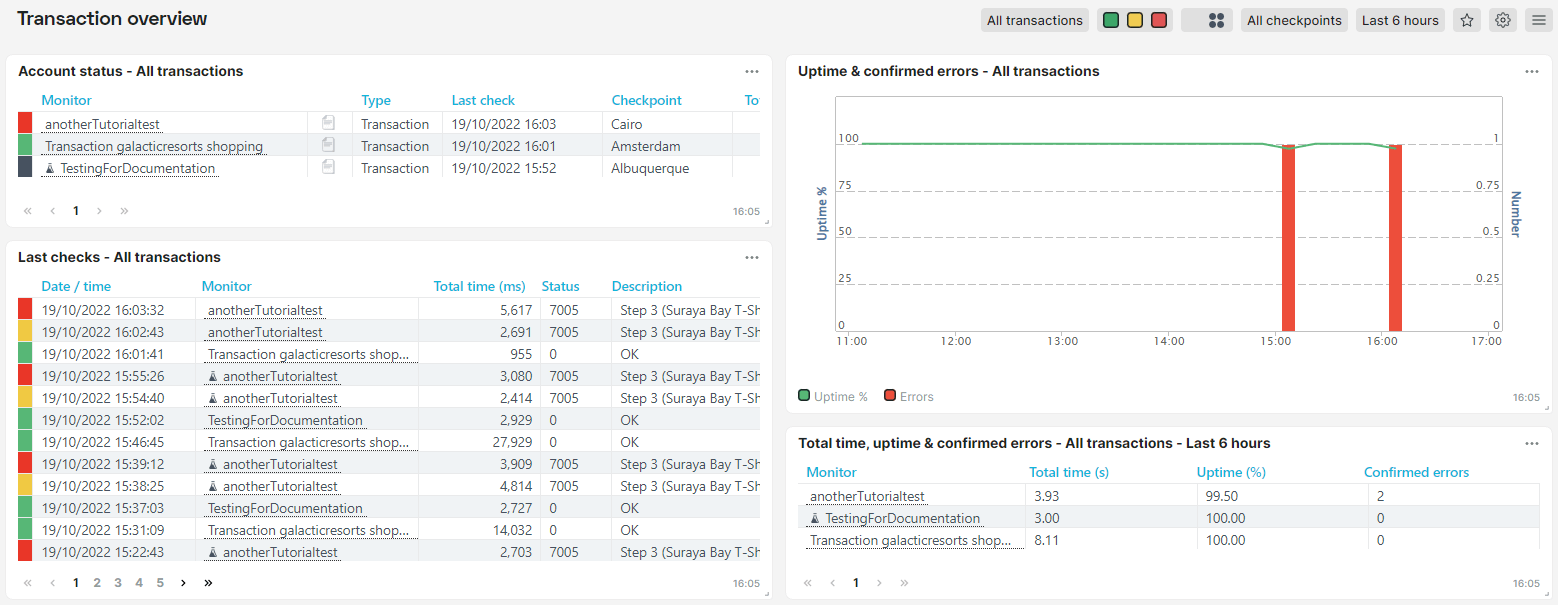
Your Transaction overview dashboard contains tiles with the current status, a log of recent checks, uptime and performance info, and a graph of the uptime and performance for your transactions. There are basically two dashboard tile types: chart and list. The type list presents the monitoring data as a table while a tile of type chart shows the graphical representation of the data.
Note that the Transaction overview dashboard does not include any information about your transaction monitors in development mode.
To access the Transaction overview dashboard: Go to the menu .
Account status
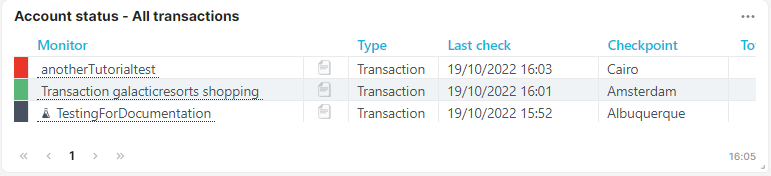
The Account status tile gives you the current status of your transaction monitors in both staging and production mode. From this table, you can quickly switch your monitors between active and disabled, and you can turn alerting on and off for your transactions in production mode.
Last checks
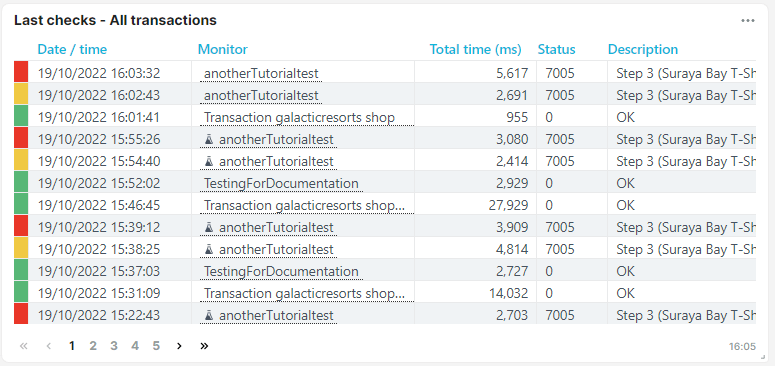
The Last checks table is a chronological log of recent checks. You can use the Last checks tile to click on a specific check (click the date) and see the Check details report. The camera icon in the Status column indicates that the Check details report includes one or more screenshots.
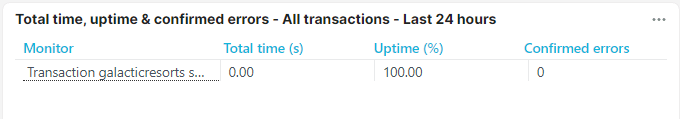
Total time, uptime, and confirmed errors
This list gives the average total time, the uptime percentage, and the number of confirmed errors for the reporting period. Of course, you can also include other metrics by opening the three-dot menu to access the tile settings.
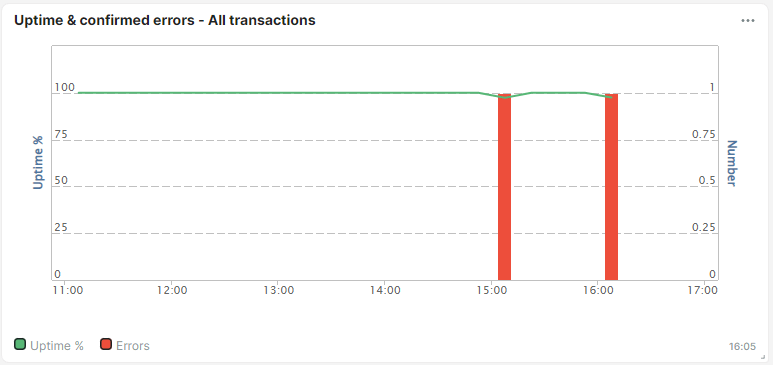
Uptime and confirmed errors
The Uptime & confirmed errors tile gives you a graphical representation of the average uptime and errors occurring during the reporting period for all of your transaction monitors in production mode.
Transaction drill-down report
The Transaction overview contains data of all transaction monitors by default or the ones you have chosen for this dashboard. If you want to look into the details for a single monitor you should do the following:
On the dashboard’s tiles in various places the monitor names are shown with a dotted underline. Hover over the name of the monitor that you want to inspect further. A quick access pop-up appears:
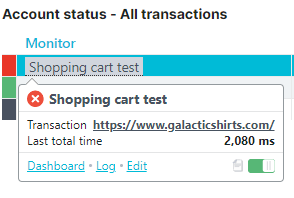
Click the Dashboard link in this pop-upto open another dashboard specific to the monitor. This dashboard is full of information that you can only get on a per-monitor basis.
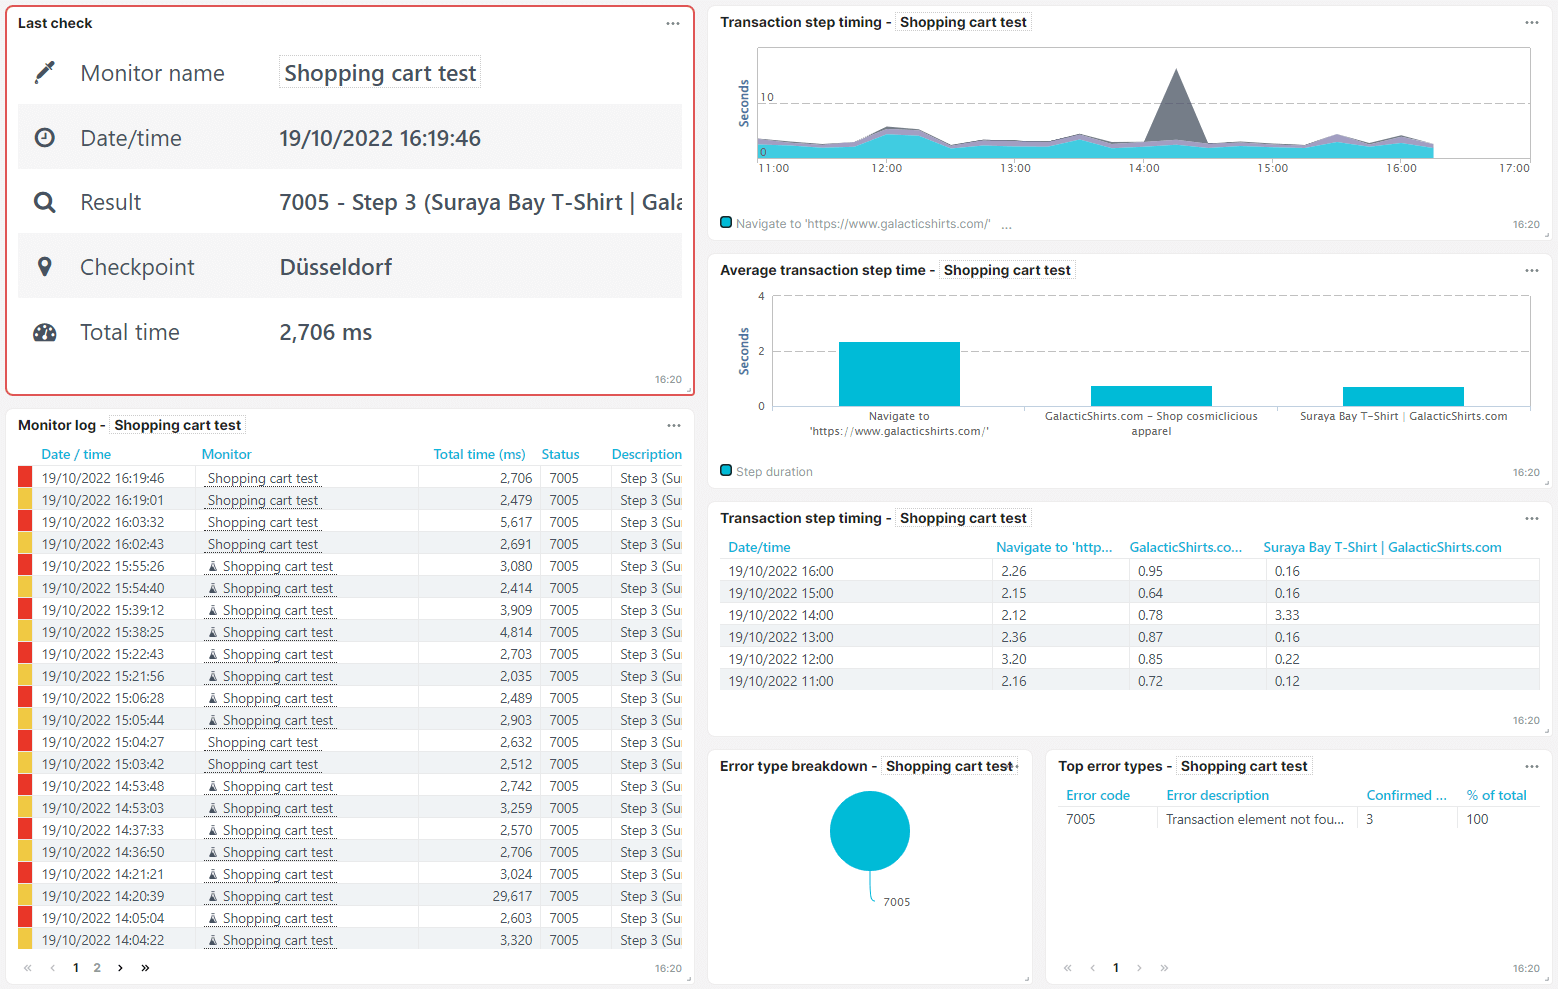
Transaction step timing lists and charts
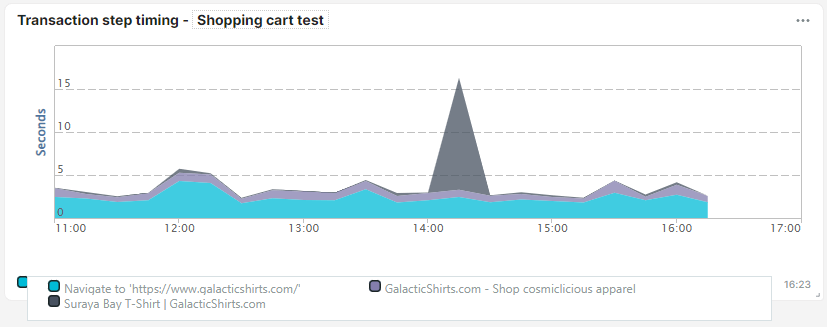
The amount of time each action takes is as important as the initial page load time when a user enters a site. Long wait times between user interactions erode user trust and confidence in your product and brand. The Transaction step timing lists and charts are designed to help you identify potential problems and spot trends.
The Transaction step timing graph. This dashboard tile shows the duration of each step in the transaction as measured for each monitor check over time.
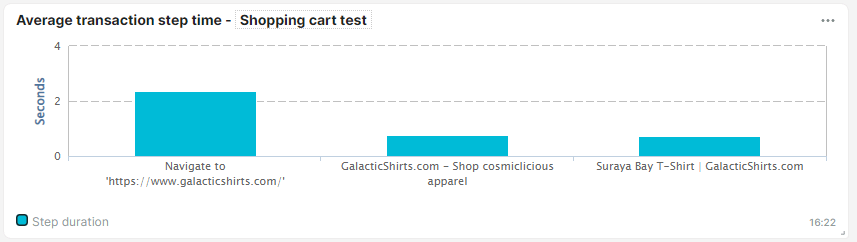
Another way of looking at how the transaction performs is to check the average time needed for each step. Depending on what should be expected from a step, long average step durations could be a hint that something isn’t working optimally.
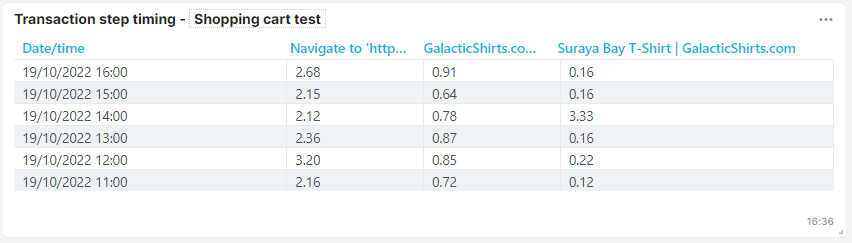
The Transaction step timing list shows you the step timings for each test in figures.
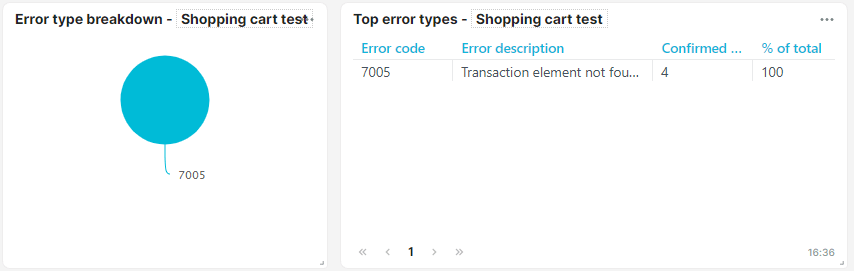
Error type list and chart
Your Error type list and chart give you an overview of the confirmed errors your monitor found during the reporting period.
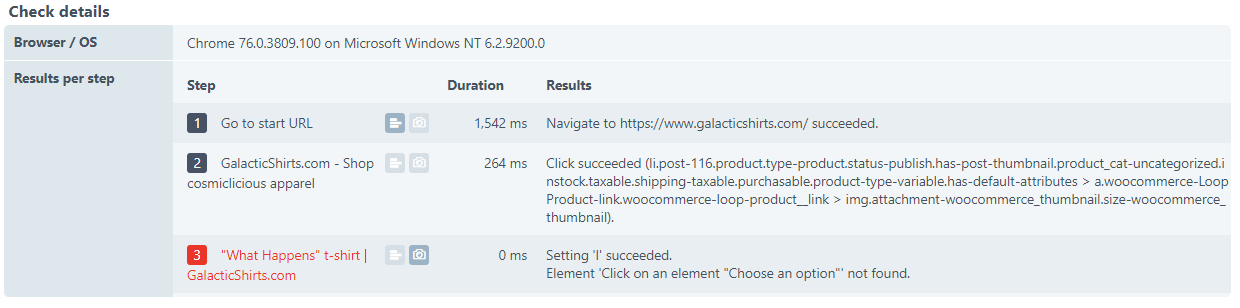
Check details
You can view the results of an individual check by clicking on the corresponding entry in the Last checks tile on your Transaction overview dashboard or from the Monitor log tile on the monitor’s own dashboard. You’ll notice that all the information is there: Date/time, result, checkpoint, load time, browser type and version, operating system, and the results per step.
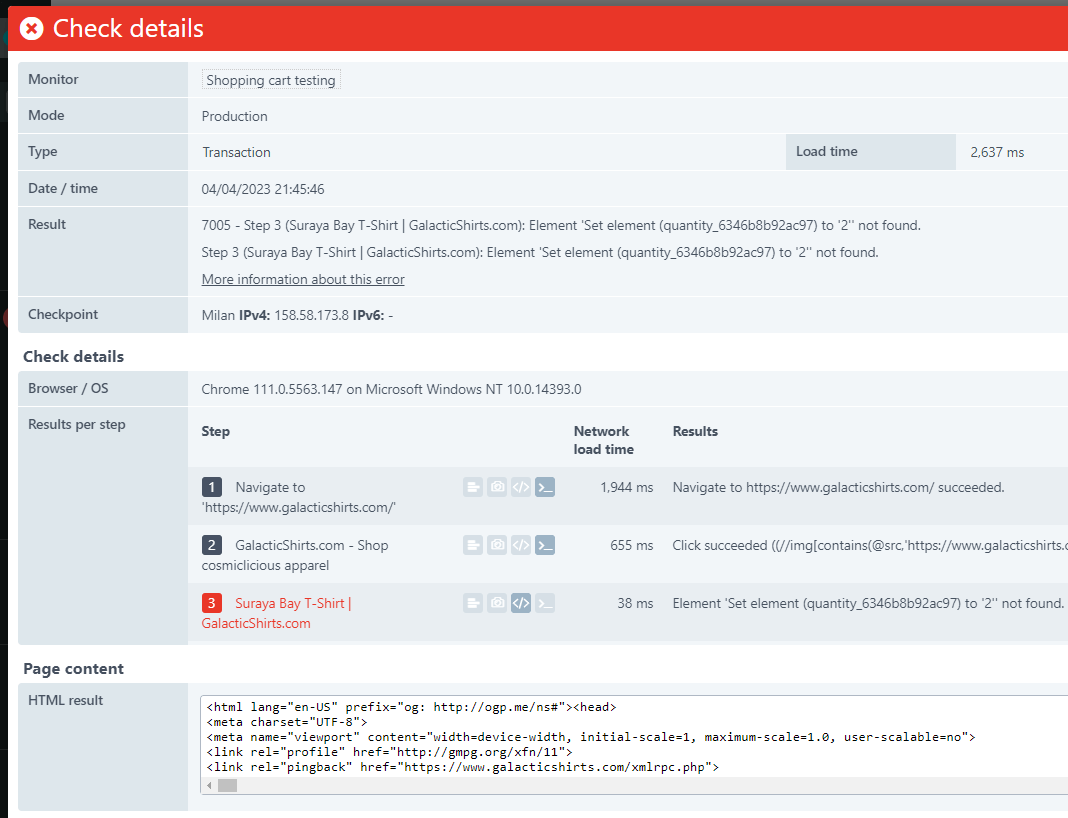
Usually the Load time (see report above) refers to the time to request and load one page in the browser. However, for transactions, load time is the total amount of time the transaction took to complete from the first request to the last action (the sum of all step durations).
Results per step
Your Results per step should look familiar to you. The section is a reflection of your script broken down by step with the result of each action taken. You get the duration per step and the outcome of each action. If an action fails, the test aborts and the step is highlighted in red in the report. If you have a Business or Enterprise account, the Check detail report is where you can access your waterfall charts and screenshots, e.g. clicking the waterfall icon (next to the step name) opens the waterfall belonging to the step.