Uptrends' transaction monitors come with several options for analysis and debugging. Two of those tools are screenshots and waterfall reports. The tools are an essential part of your transaction monitoring toolkit, and are essential for root-cause or performance analysis.
Enabling waterfall reports and screenshots
- Navigate to the settings of the transaction monitor you’d like to enable waterfalls/screenshots for (for example, via in the sidebar menu).
- In the Steps tab, select the step you want to activate a waterfall/screenshot for.
- Check the appropriate checkbox to enable a waterfall or screenshot for that step.
-
Note that you can also add screenshots halfway through steps by adding them as an action.
-
In order to view the page source and console log data, the waterfall option must be enabled.
Keep in mind that waterfalls and screenshots will cost a transaction monitor credit for each one you add.
Uptrends generates a waterfall or screenshot in the following situations:
- In case of errors: when a confirmed error occurs during a transaction, a screenshot (but not a waterfall) will be generated. You don’t have to set anything up, this happens automatically for the first confirmed error.
- Every monitor check result: When you have enabled a waterfall or screenshot in a specific step, after the step completes.
Finding your waterfall reports and screenshots
Screenshots and waterfalls are indispensable when it comes to troubleshooting and debugging transaction errors. You get them automatically when you use the Test now button, and Enterprise and Business users get a screenshot on the first confirmed error.
Where are my screenshots and waterfalls while debugging?
You use the Test now button a lot when you’re testing your transaction in development mode. An important feature of the Test now results are the waterfall reports and screenshots. To access these, click the Test results available button located at the top of each step after running a manual test.
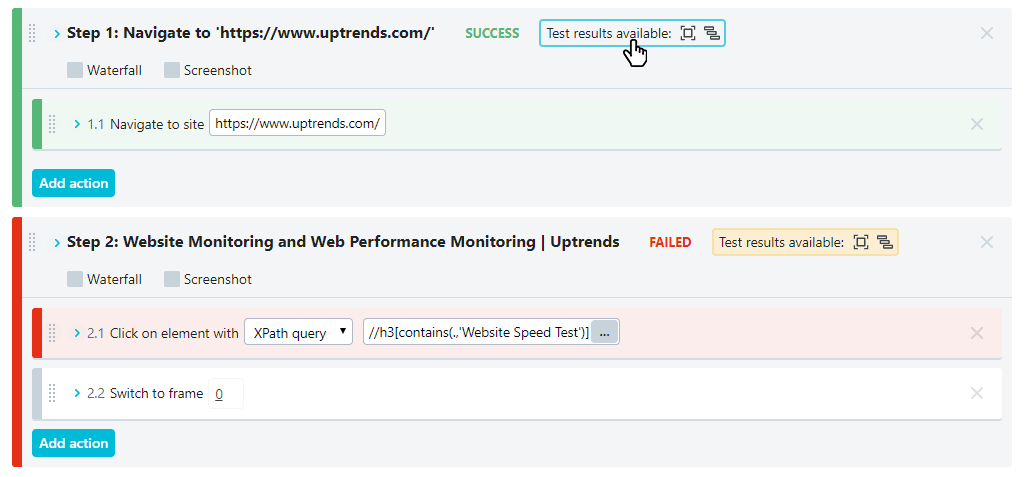
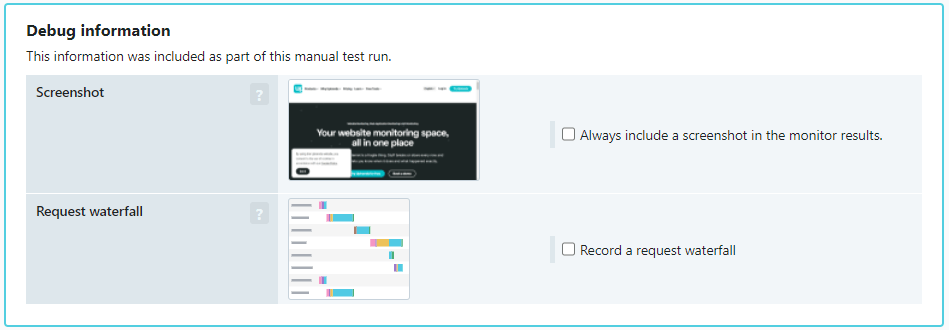
After clicking the Test results available button, scroll down the page to the Debug information. The report automatically includes the debug details during manual tests.
Click the graphic to access the screenshot or waterfall.
Where are my screenshots and waterfall charts in my reports?
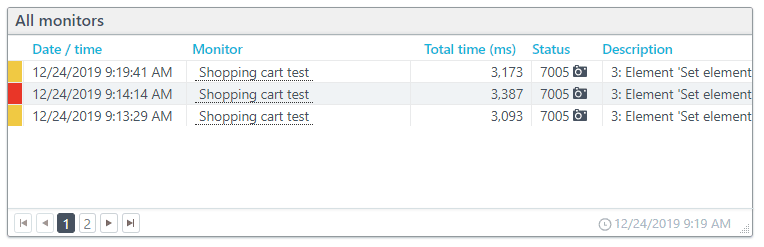
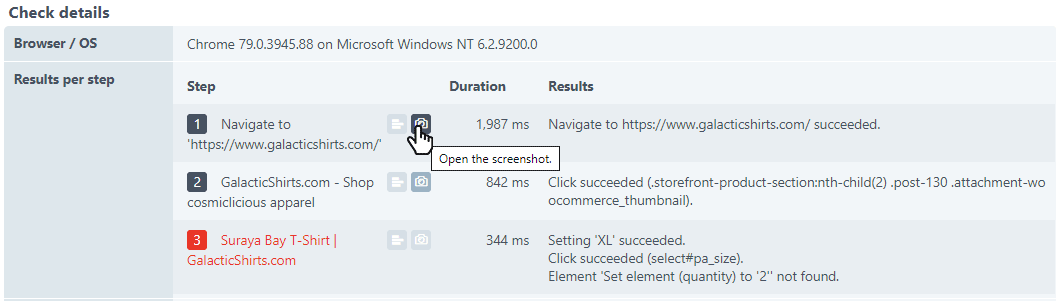
Enterprise and Business users can find their staging and production screenshots in their check detail reports. Navigate to on the Uptrends menu to see your monitor log.
Screenshots: You know if a detail has a screenshot when you see a camera icon in your monitor log.
Waterfalls: If you’ve added waterfall charts to your transaction scripts, each check will include the chart(s). The Monitor log doesn’t show an indicator.
To view the screenshot or waterfall charts:
- Click to open the Check detail report.
- Locate the Check details section.
- Click the camera or waterfall icon in your step results.
Using screenshots for debugging
So that you can see the on-screen result of a step, your test generates a screenshot. The screenshot shows you what the viewport looked like after a successful step or page error. If the action occurs further down the page, you can add a scroll action before the click event.
Study the screenshot to verify:
- Expected content loaded. After a page navigation check for correct content.
- Dynamic content resulting from user input works well. For example, if item selection requires the user to select a color before size options become available to verify that the element populated properly.
- Masked fields work as expected. Is the character formatted correctly?
- Responsive design changes. If your site uses responsive design, you may need to adjust the browser resolution in your monitor settings. By adjusting your browser resolution, you can ensure that you’re getting the correct page layout. For example, if your menu reduces down to a hamburger icon when the browser window gets smaller, you may need to add additional click or hover actions. Check under the monitor’s Advanced tab adjust your browser resolution.
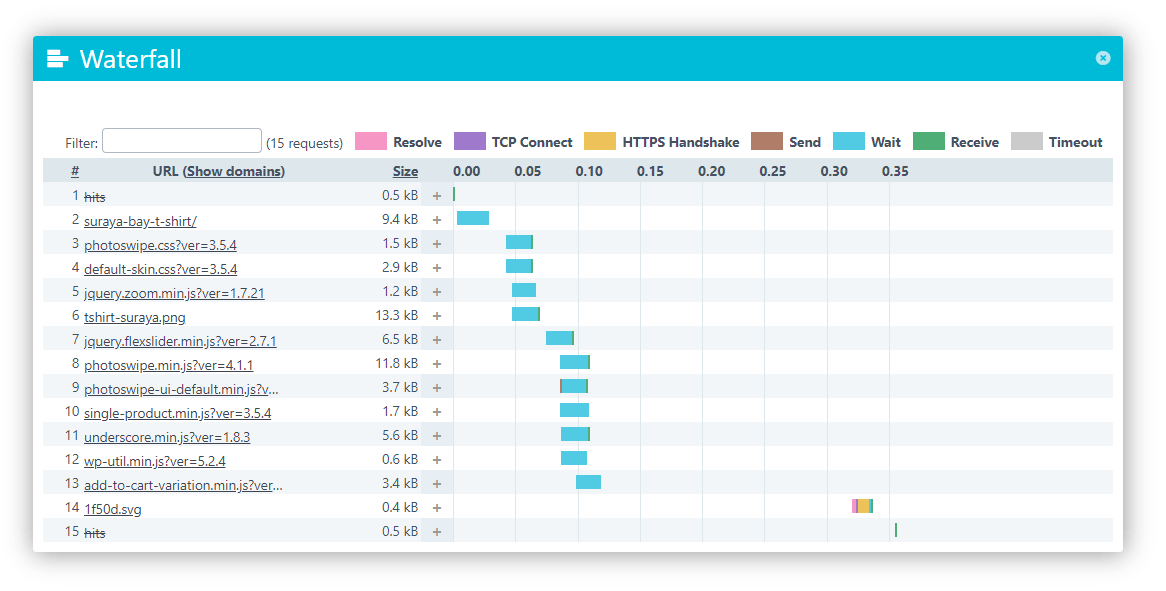
Using waterfall charts for debugging
The waterfall report gives you detailed information about the initial page’s load time. It tells you exactly how long it took to retrieve and process each page element along with the request and response headers. Your waterfall will help you quickly identify problems on the page. See our article on the waterfall chart for a more in-depth look at what is presented in the waterfall chart and how it can be used for debugging.