
When you log into your Uptrends account, you’ll see the user interface (UI), which will look similar to this:
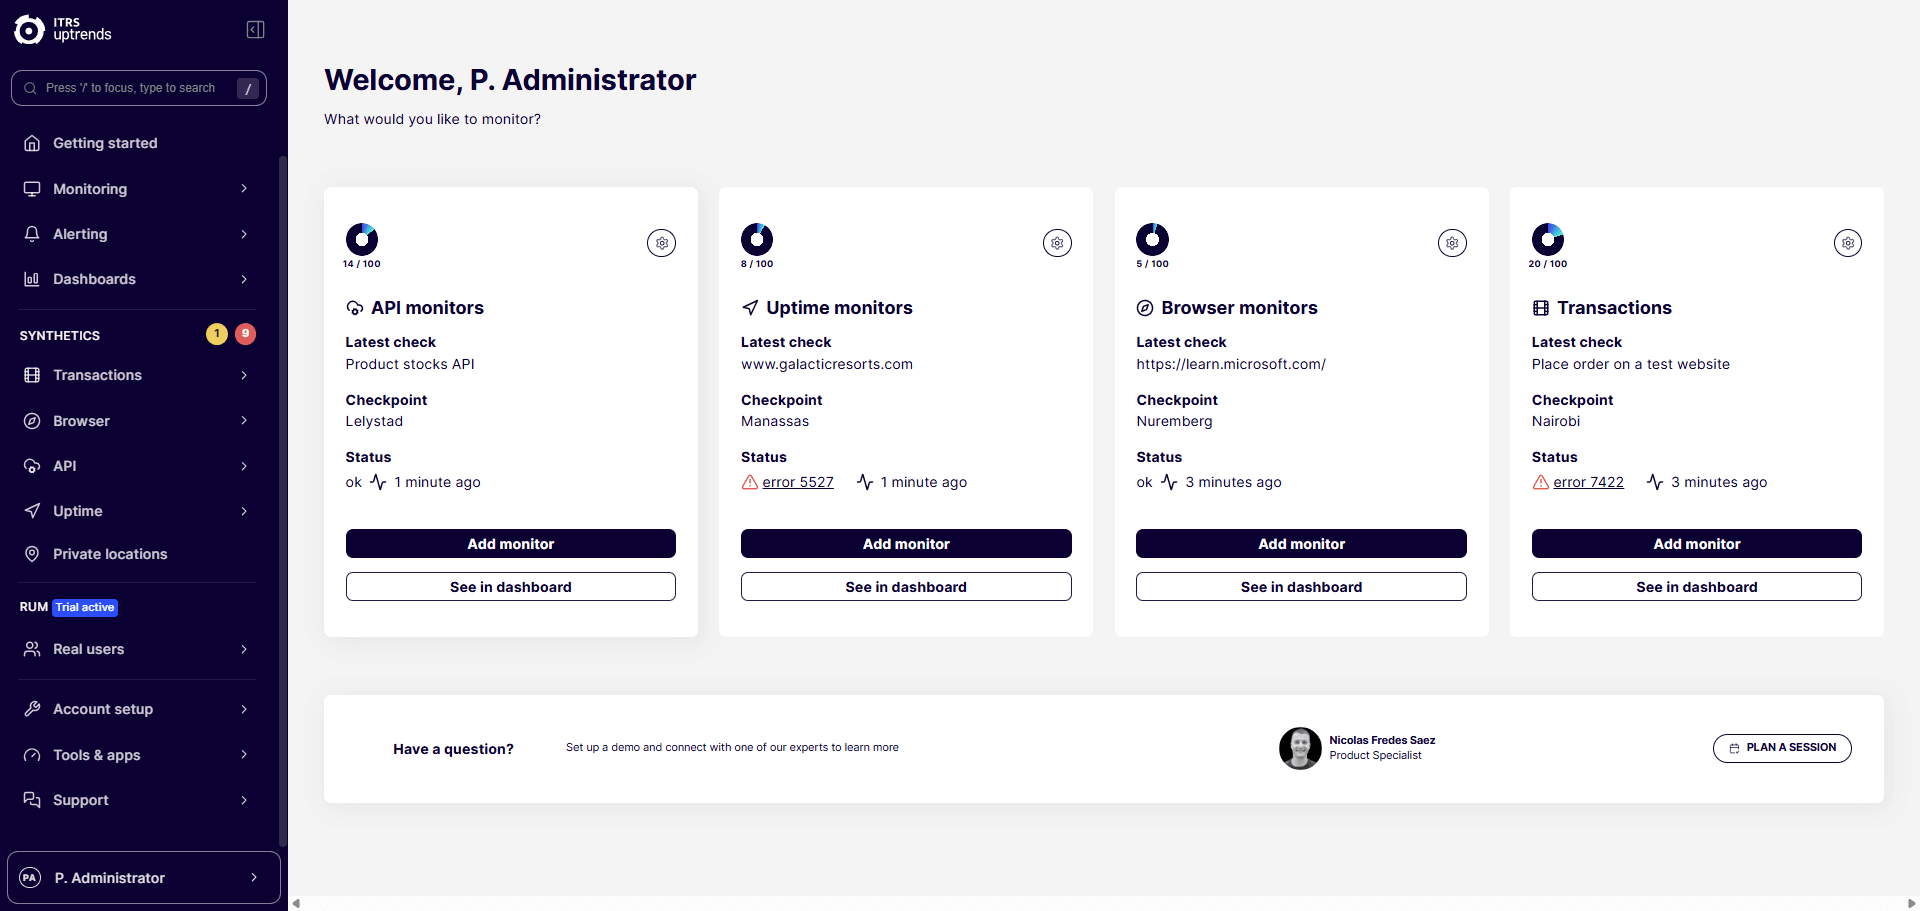
The exact look of the UI depends on which products you are subscribed to and a number of settings.
The biggest part of the screen shows the listing of configurable items, setup pages or dashboards that contain monitoring information. Next to it you find the main menu.
Main menu
The main menu is located on the left side. From here you can reach all of your setup pages, dashboards, hubs, some knowledge base articles and user settings.
For a detailed description of the menu, please visit the article Main menu.
Display
Next to the menu you find the display that can hold different types of information:
- Hubs
- Dashboards
- Page with lists of Uptrends items like monitors or integrations
- Settings page for individual items, e.g. for monitor settings
- Context menu at the top right for dashboards, list and settings pages