
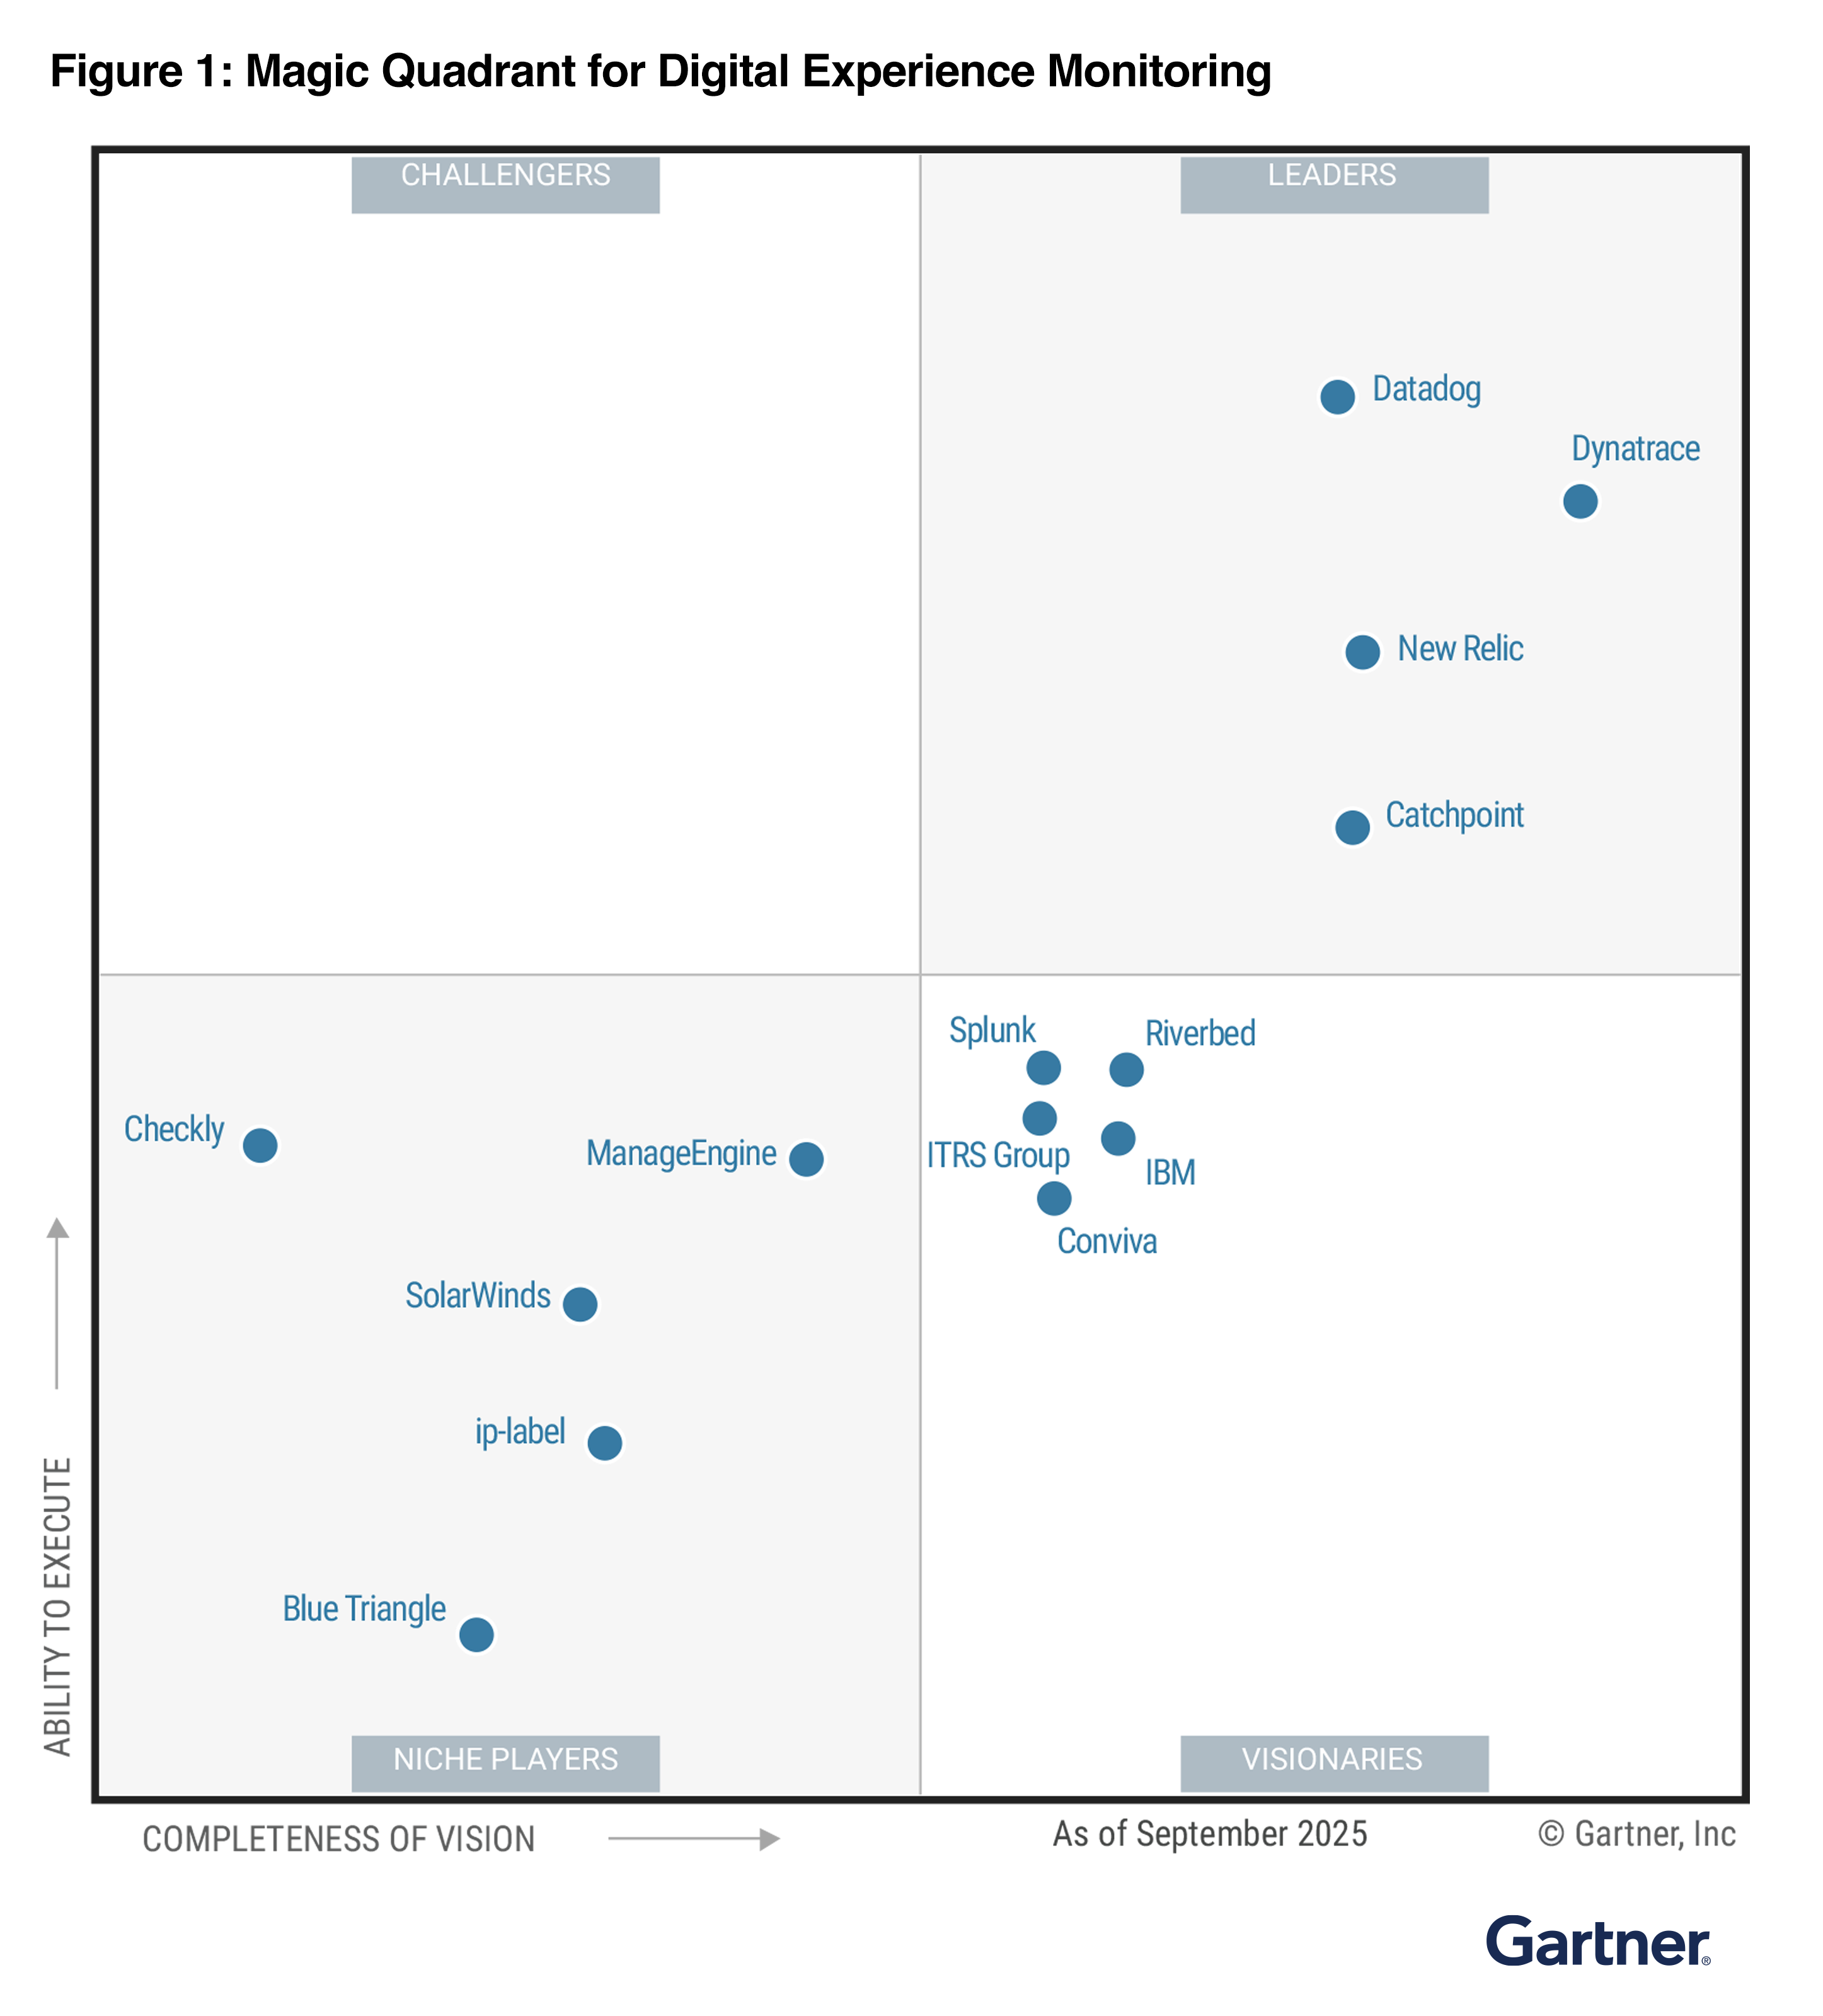
A Visionary in the 2025 Gartner® Magic Quadrant™ for Digital Experience Monitoring
Discover why ITRS has been recognized.

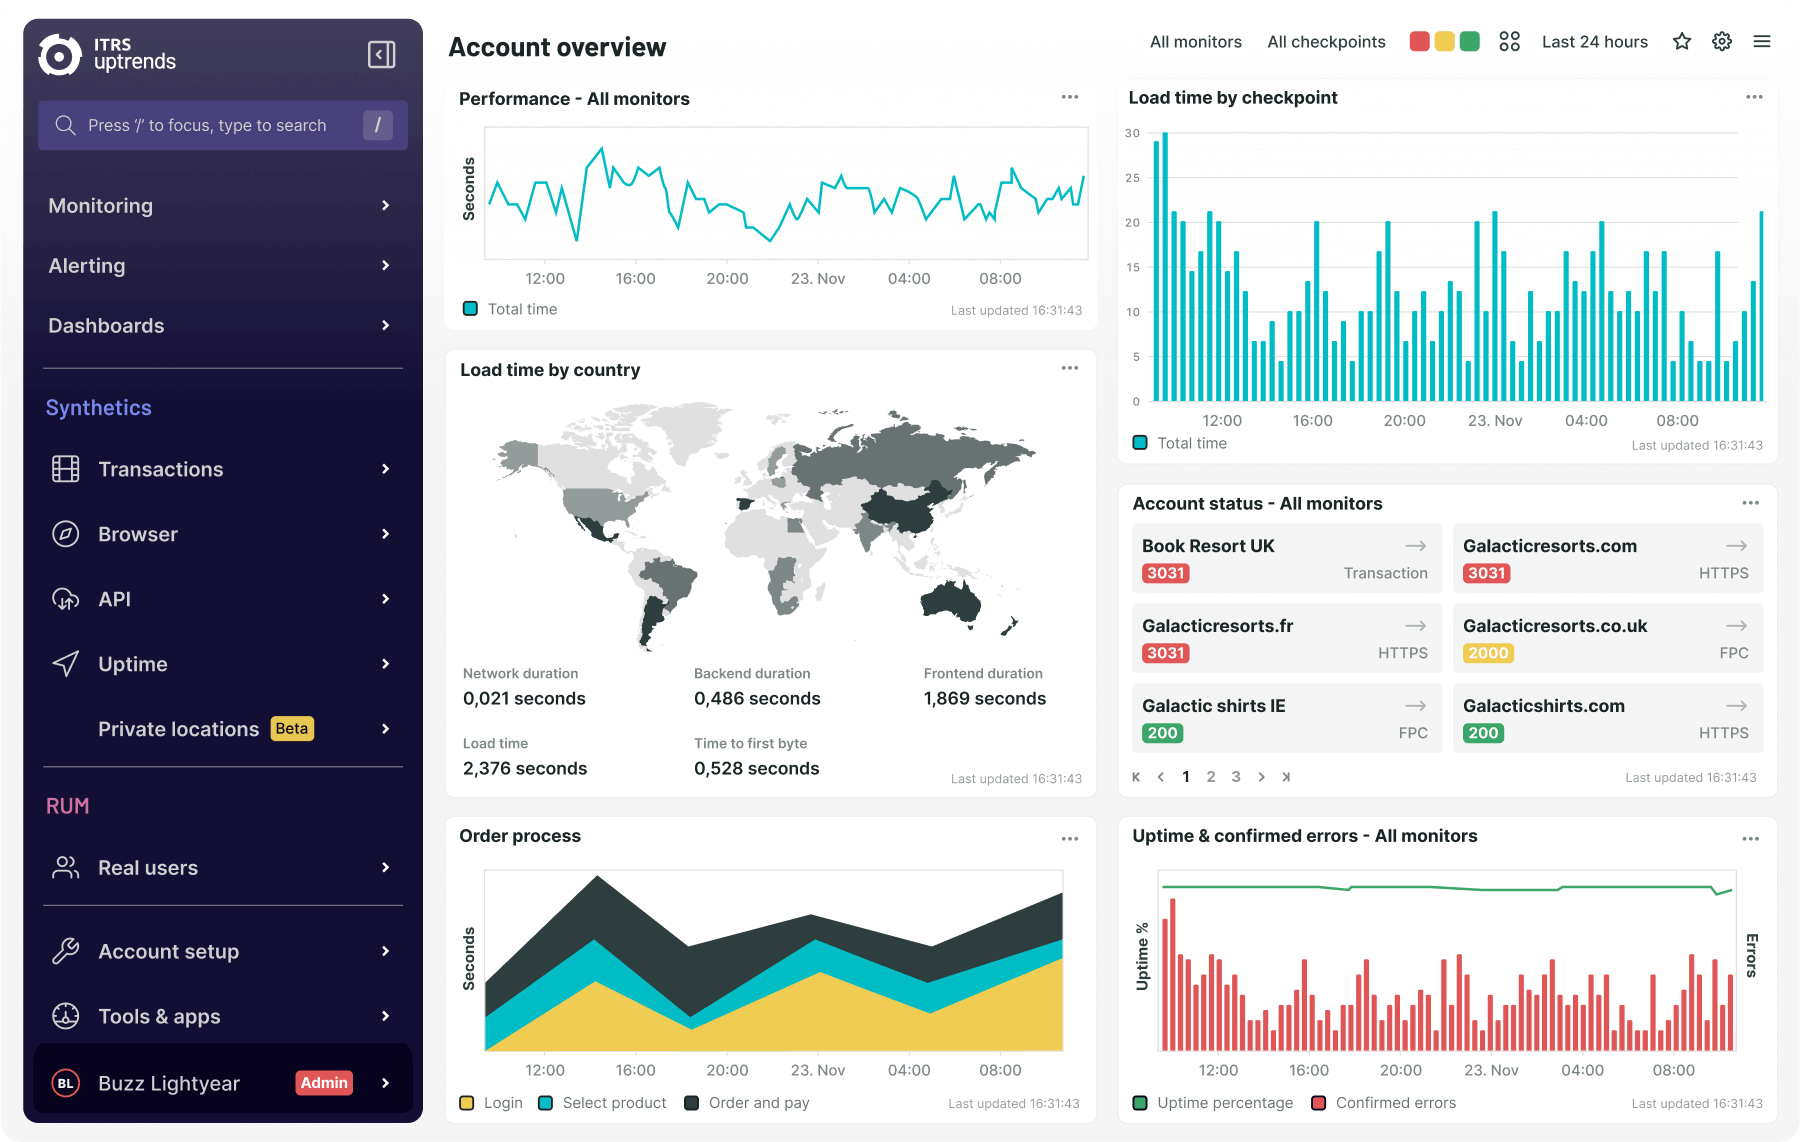
Resolve website, web app, and API problems faster
Maintaining high-performing websites and APIs with optimal availability is challenging. By implementing website monitoring at frequent intervals (up to the minute) combined with precise alerting, you can quickly identify and resolve issues.
Explore Synthetic Monitoring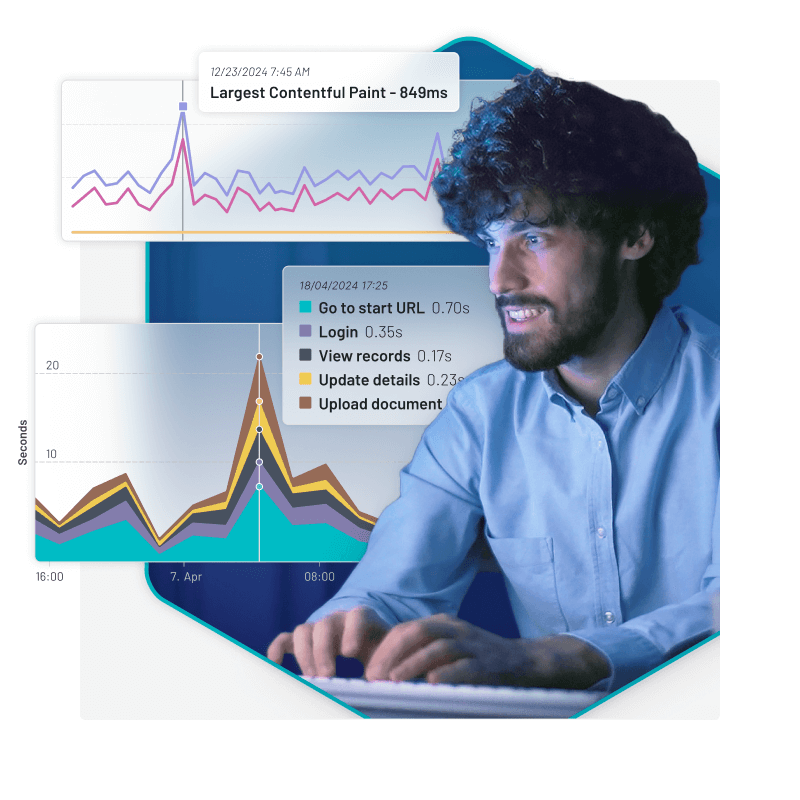
Web Application Monitoring
Monitor user journeys in your web application, such as shopping carts, checkouts, and logins. Easily record your scripts, or let Support help you setting it up.
API Monitoring
Gain deep insights into your APIs with continuous API monitoring. Track API uptime and multi-step API calls to validate API response accuracy and API performance.
Web Performance Monitoring
With web performance monitoring, you know exactly which element slows down your site. Use the latest Chrome and Edge browsers to monitor Core Web Vitals and W3C metrics.
Uptime Monitoring
Know your website uptime and website speed from 229 global checkpoints. Detect region-specific issues like local outages or performance slowdowns.

“It’s like you are sitting behind the user and experiencing what they’re experiencing.”
Boost IT productivity with smart alerting and automation
Reduce MTTR with Uptrends’ reliable alerting system that eliminates false positives. Customers who’ve switched to Uptrends praise the reduction in alert noise, receiving timely notifications only when there’s a real issue.
Receive alerts via email, SMS, phone calls, or mobile apps, and integrate with tools like Slack, Microsoft Teams, or PagerDuty. For custom needs, build tailored integrations using webhooks to streamline your monitoring alerts.
View all integrations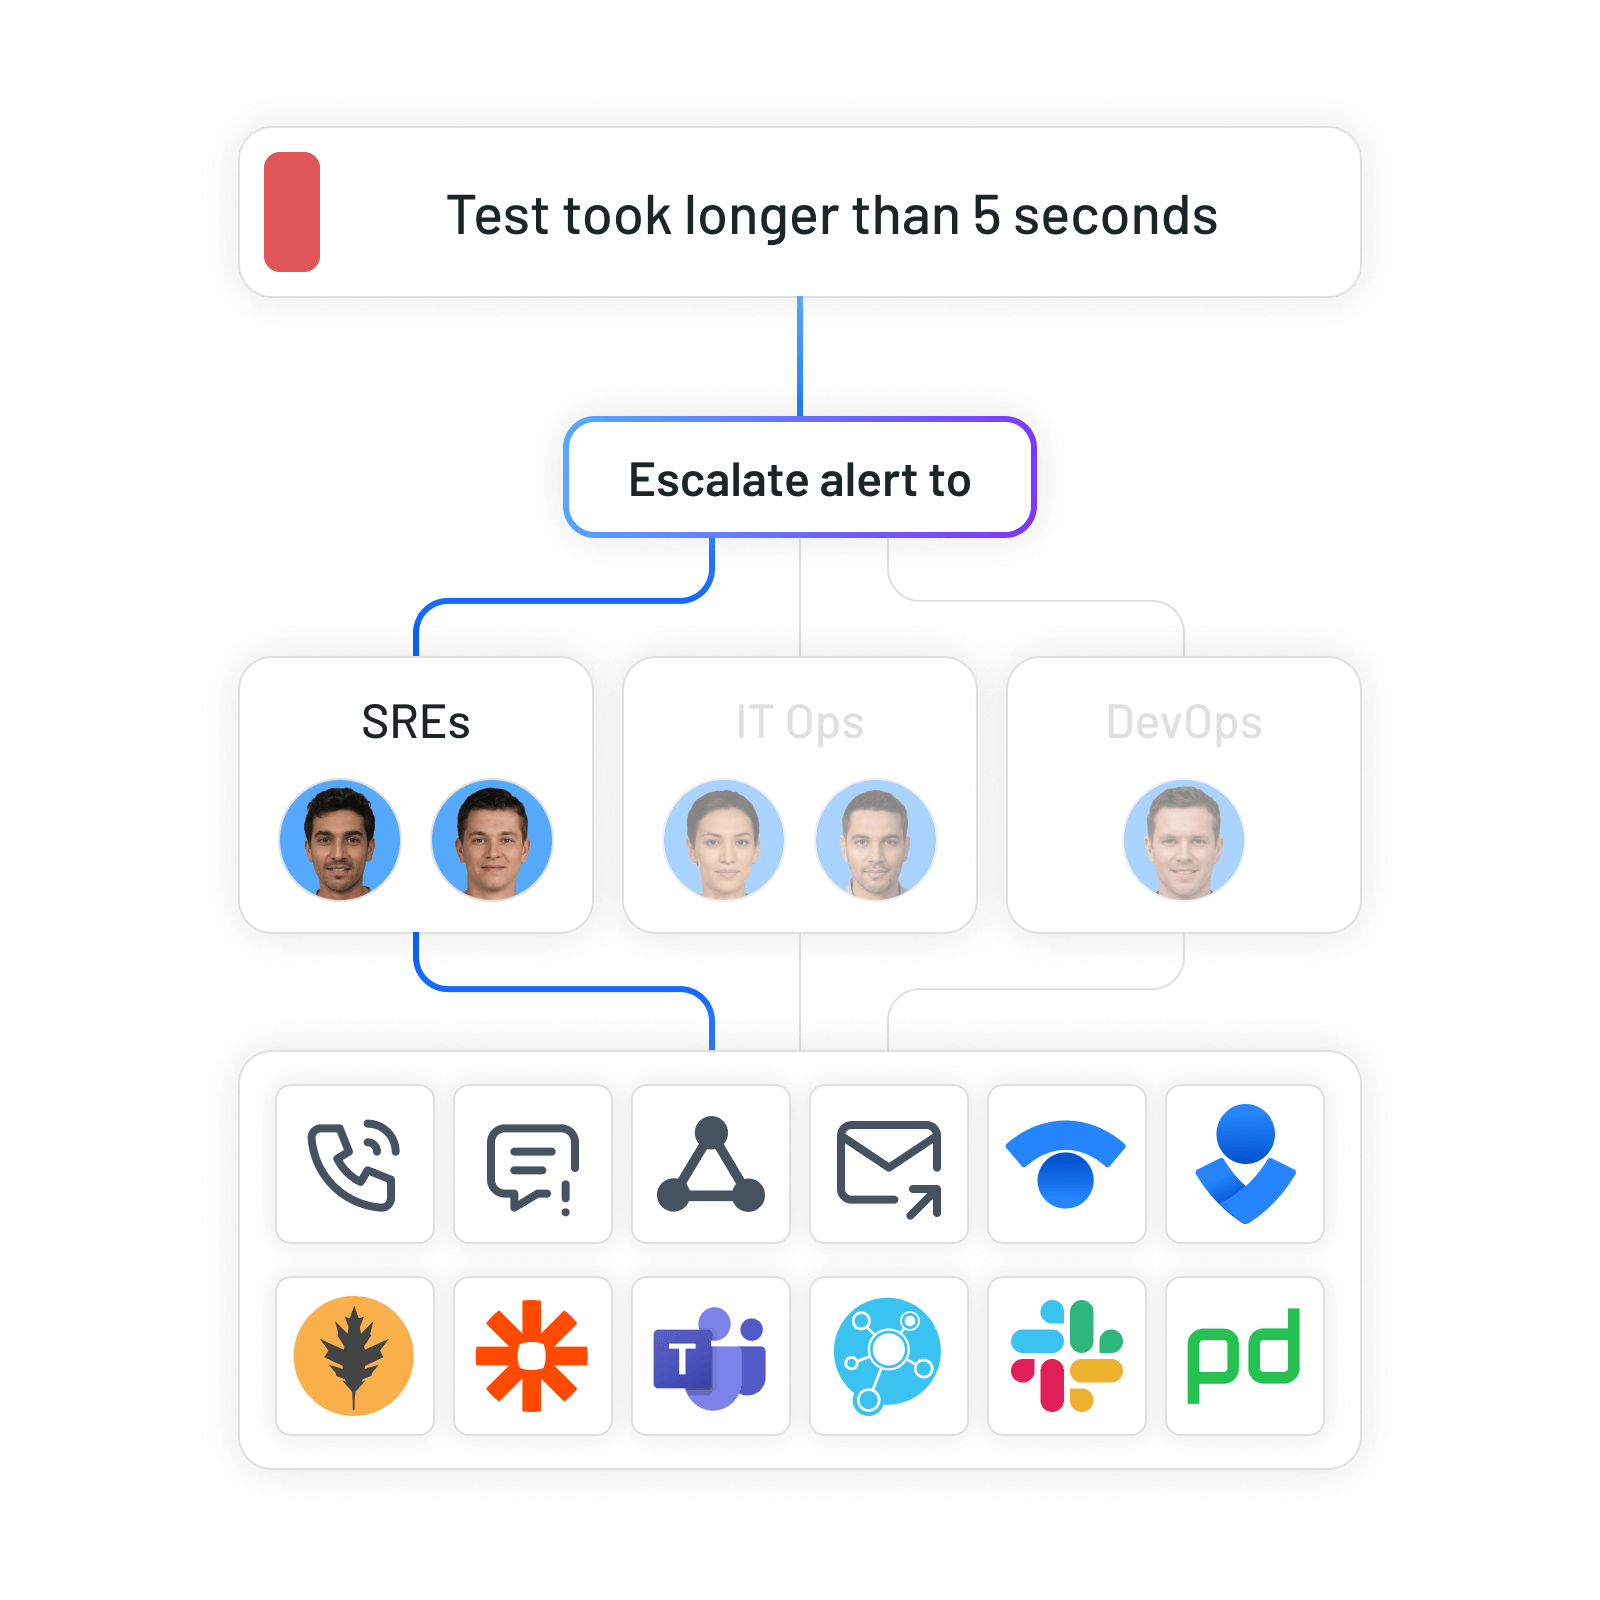
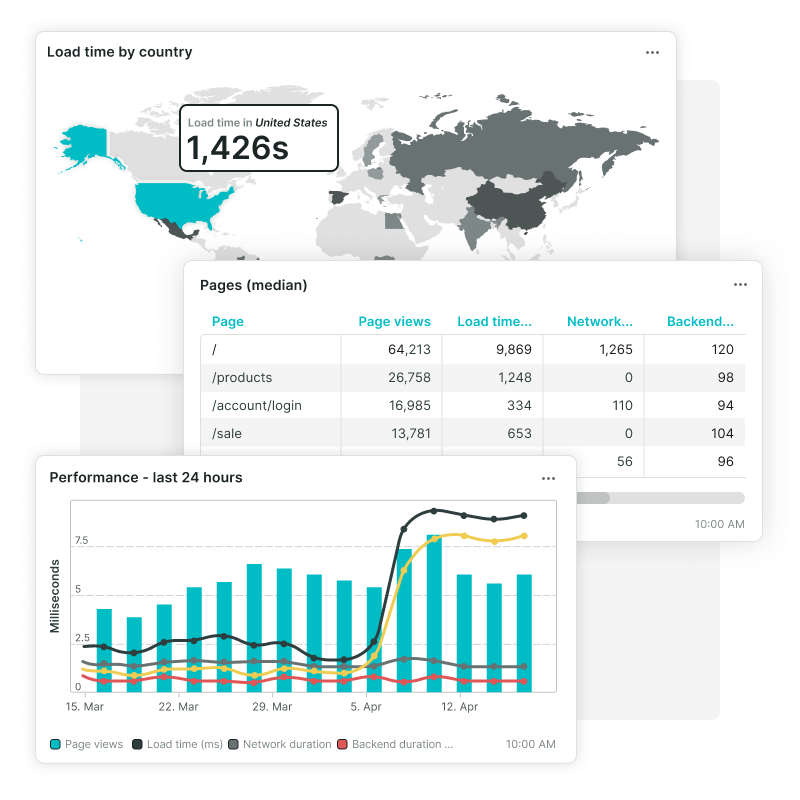
Make your site faster and your users happier
See how real users experience your website by viewing load times per browser, OS, location, and device type.
Combine RUM with Synthetics for a complete Digital Experience Monitoring strategy.
- Get location-based performance metrics straight from your visitors' locations arranged by country and state.
- Fine-tune your site’s performance for the benefit of your customers based on the technology they actually use.
- See how each environment variable affects performance.
Get started for free
Start your website and API monitoring journey today and test the Uptrends monitoring platform free for 30 days. Your full-featured trial expires automatically, and we don’t need your credit card.
Give Uptrends a try