
The dashboard tile of type Simple data chart can now show the metrics of individual checks. Until now the metrics were always showing averaged data for periods depending on the time period selected in the dashboard.
We have now added a new resolution “Individual checks”. When using this resolution, individual checks are shown in the data chart. The frequency depends on your monitoring check interval. In this example the interval is set to 1 minute and the chart shows measurements for each minute:
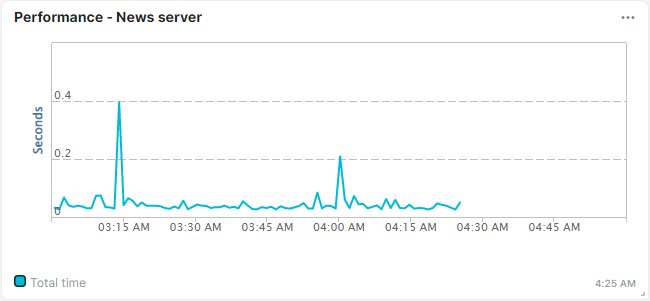
The advantage is that with a higher resolution you can more easily find the points of interest by looking at the peaks in measurements. Hovering over the graphic will show the value and timestamp. Clicking on the graphic will bring you to the corresponding check details.
Note that a few conditions apply:
- The individual checks are available only for the simple data chart tiles.
- Individual checks are supported for the metrics: total time, resolve time, connection time, and download time.
- If a tile shows unsupported metrics (also if combined with supported metrics), a lower resolution than the individual checks will apply.
- The maximum preset period that can be chosen in combination with individual measurements is 24 hours.
- Only one monitor can be chosen per tile when using this new feature.