#Easily convert Uptime monitors into API monitors on the API hub
The
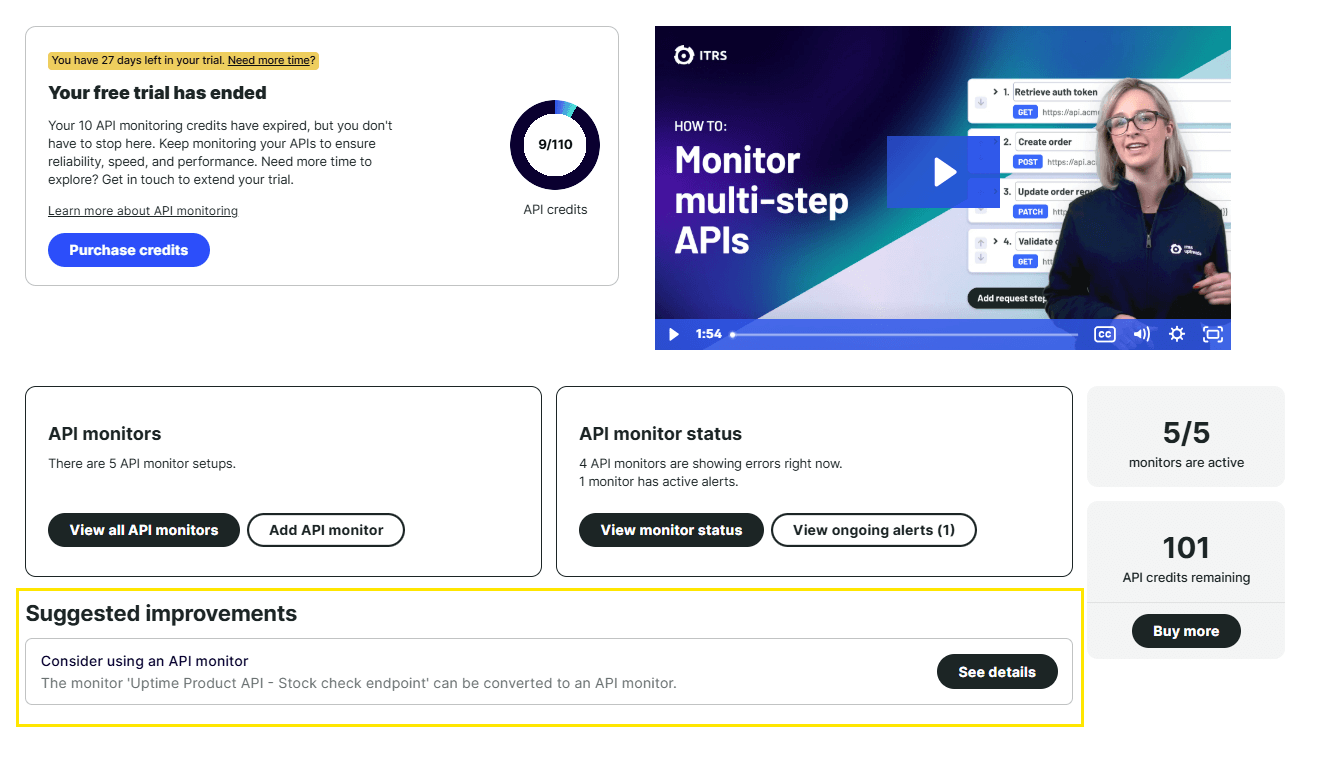
API hub now includes a feature that automatically scans your existing monitors and identifies those that can be converted into
API monitors. If it detects any HTTP or HTTPS monitors that appear to check an API endpoint, it will offer the option to automatically create a new API monitor for you.
This functionality instantly upgrades any
Uptime monitor into a fully configured API monitor without deleting or modifying the original monitor. You can freely undo the action at any time if needed. Also, there’s no need to manually recreate everything from scratch, Uptrends handles all the setup, replicating the same settings from your existing monitors.
Once converted, you can review the configuration and enable it for use. For more information, refer to the
Multi-step API hub knowledge base article.