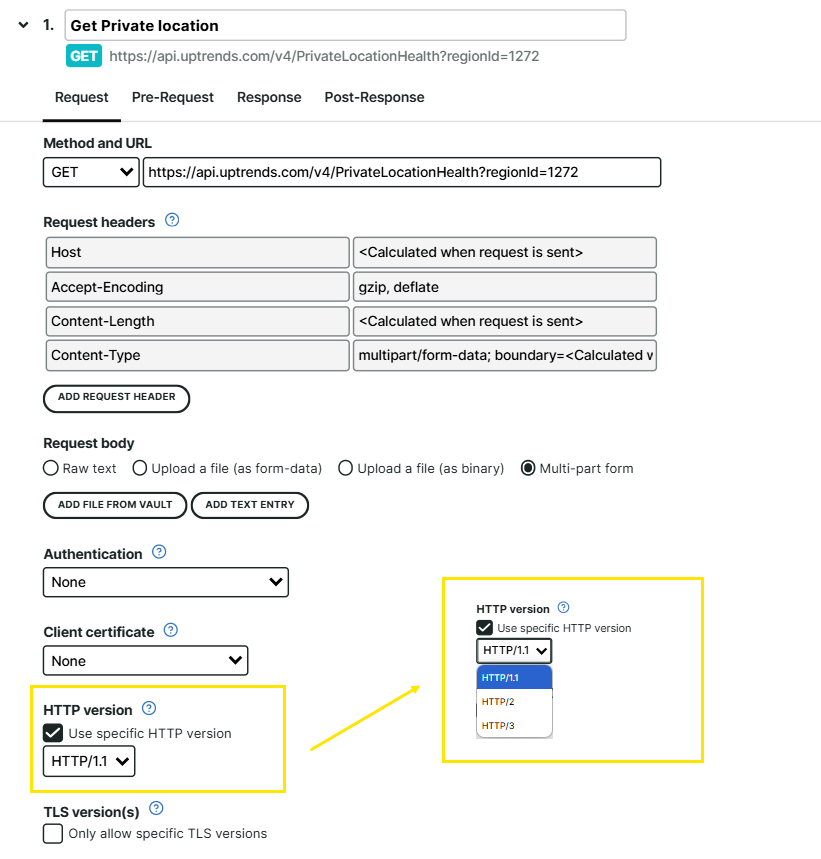
ITRS acquires IP-Label. Read the press release.

What’s new

See the latest features and product updates in Uptrends
View the API changelog and reported issues in the Incident log.

Submit a feature request

UPDATE

FEB 2025

#Maintenance periods overview updates

Operators that have Edit settings monitor permissions for at least one monitor can now access the Maintenance periods overview page. Previously, only administrators had access to this page.

Operators can view, Clean up, or Delete all maintenance periods for the monitors they have Edit settings permissions for.

UPDATE

FEB 2025

#Introducing the Monitor permissions overview

The Summary of monitor permissions overview is now available in the User Management hub. This overview lists all your monitors and their individual operators and operator group permissions:

From the User Management hub, clicking the number of available production monitors card opens the monitor permissions overview page. Note that this feature is available to Administrators with Enterprise-level accounts.

Summary of monitor permissions

UPDATE

FEB 2025

#Introducing the API user overview

The API user overview is now available in the User Management hub. This overview lists all your operators' API information in addition to the existing individual operator’s API information in the API management tab:

From the User Management hub, clicking the View all API users button opens the new overview page, where you can view and sort the following information easily:

  • Operator — the full name of the operator using the API
  • Username — an alphanumeric string representing the API username
  • Type — the API type or where the API was used (Generic - most common API type, Mobile App, Transaction Recorder, Grafana)
  • Created — the period when the API was created
  • Last Used — the period when the API was last used (minutes, days, or Never used)
  • Description — a text that describes or explains what the API is used for
  • Delete — a button that lets you delete a specific API user
API user overview

UPDATE

FEB 2025

#Introducing new alerting variables

The following alerting variables are now available for use:

  • @alert.numberOfConsecutiveErrors — contains the total number of consecutive errors (confirmed errors) of the alert. This returns 2 when the API response is {"numberOfConsecutiveErrors": "2"}.
  • @alert.checkpointName — contains the checkpoint’s name or location where the alert was last checked. This returns Ghent, Belgium when the API response is {"checkpointName": "Ghent, Belgium"}.
  • @‌alert.responseHeaders — contains the response headers of the alert in key-value pairs. For example, this returns {"Content-Type": "text/html"} from the API response header, similar to how the values are returned for @alert.responseBody.

Note that the value of the @‌alert.responseHeaders can be empty if the Private location data protection is enabled on a private checkpoint location performing the alert check. For more information, see Alerting system variables.

UPDATE

JAN 2025

#Custom metrics now show the minimum and maximum metric values

The Custom metrics in Multi-step API monitors (MSA) let you create custom metric variables to collect and store numerical data from an API response step.

These metric variables can be displayed through a Custom metrics chart, showing the metric’s trends over time. Before, the chart only shows the custom metric’s average value (high points) as a data point. Now, the custom metric’s minimum and maximum values are also displayed. Note that existing MSA monitors with custom metrics data from 1 November 2024 onward will be reflected in your Custom metrics chart.

Custom metrics chart with minimum and maximum metric values
By using the Uptrends website, you consent to the use of cookies in accordance with our Cookie Policy.