
Monitor setup
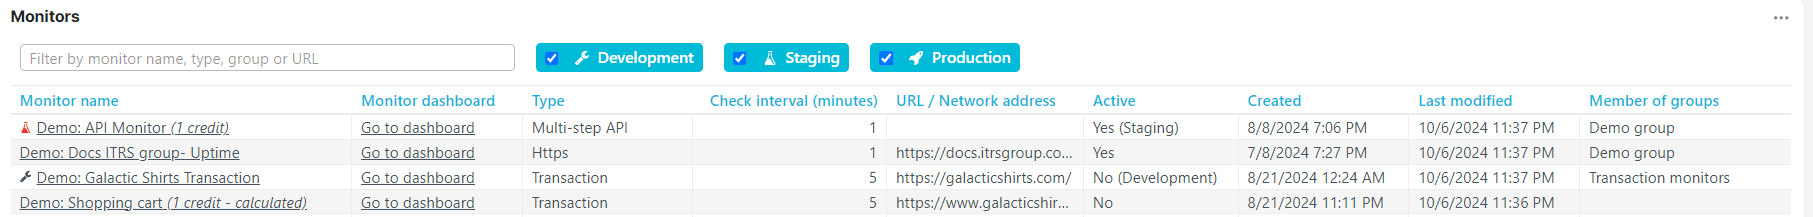
With all the monitors set up in your Uptrends web application, the Monitor setup shows a summarized table to conveniently see all your monitors and monitor settings in one place. This allows you to view, filter, and export monitor setup made in your account.
View monitor setup
You can easily visualize and check your monitor settings, including:
- Monitor name — specifies the name of your monitor setup and the number of monitor credits used. A laboratory flask icon indicates that your monitor is in Staging mode while the wrench icon indicates that your monitor is in Development mode.
- Monitor dashboard — contains a link that redirects you to the specific monitor dashboard.
- Monitor type — specifies the type of monitor currently set up.
- Check interval (minutes) — specifies how often your monitor is being checked.
- URL / Network address — specifies the URL or the IP address of the website or web service you are monitoring.
- Active — specifies whether your monitor is enabled or disabled. You will see Yes if the monitor is enabled and active, otherwise, it will show No. Enabled and disabled monitors also state the current mode of your monitor, whether Staging or Development, enclosed in parentheses.
- Created — shows the date and time you created the monitor.
- Last modified — shows the date and time you last updated or saved changes to your monitor.
- Member of groups — specifies which monitor groups your monitor belongs to.
Filter monitor setup
To easily narrow down your monitors, you can use the text field to filter by monitor name, type, group or URL. You can also select the Development, Staging, and Production checkboxes to filter by monitor modes.
Export monitor setup
As the Monitor setup is helpful in visualizing and grouping your overall monitor setup details, you can also export this information for better insights and future reference. To know more information about the step-by-step process on how to export your data, refer to the Exporting dashboard data knowledge base article.
Exporting your data in any format lets you view additional monitor settings, including:
- Alert on time limits — shows your monitor’s loading and running time settings, indicating whether the error condition was set to only color-code result or generate an error status.
- Time limits — shows your monitor’s corresponding time thresholds in milliseconds (configured and related to the alert on time limit settings).
- Notes — shows the content of your Notes field description.
To retrieve the full monitor settings, you can also use the Uptrends /Monitor API endpoint.