
A browser or transaction monitor measures load time based on the W3C load event or Network advanced monitor settings.
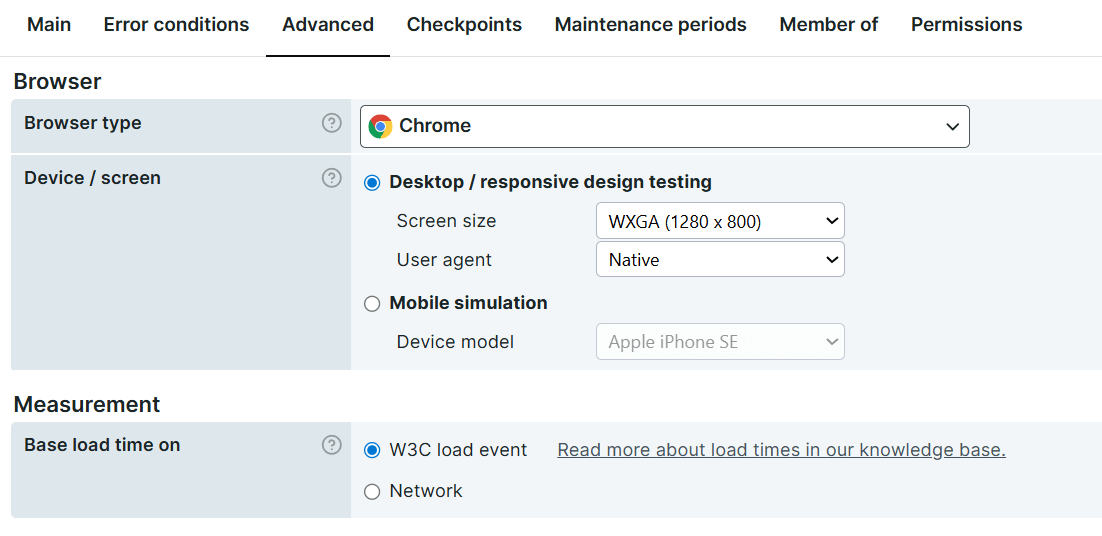
W3C load event
This setting measures when the browser reports that the page has fully loaded. It measures the load event from the W3C Navigation Total time, which browsers and web applications use to generate and display timing information. For more details, see W3C navigation timings.
In the Uptrends web application, this metric is not manually calculated. It is directly provided by the browser, specifically through the browser’s Developer Tools.
Use this setting when you want to:
- Determine the page load performance without taking into account network connection issues.
- Determine page performance based on specific resources. For example, identifying which resources take longer to load.
Network
This setting refers to the load time based on network activity. Unlike the W3C load event, it does not rely on browser events. Instead, it measures page load by tracking the browser’s network requests, such as images, fonts, stylesheets, and other resources that require network activity to complete.
Network load time is measured when all active network requests finish and the network becomes idle.
Use this setting when you want to:
- Determine the end user experience when your page loads. For example, how long it takes to complete the entire cycle of a transaction.
- Determine the effect of multiple redirects or unoptimized use of resources.
Network time takes everything into account. For transaction monitors, it also includes steps that affect how long users need to complete the transaction, even when those steps don’t involve page navigation.
Load time differences
There can be a significant difference between measuring load time using W3C load event and Network time because they track different aspects of page loading.
The results depend heavily on what is being monitored and how many navigations occur. For example, in a browser monitor, redirects may create multiple navigation actions. In this case, the W3C load event time is calculated per navigation and then summed for the complete measurement.
In a transaction monitor, multiple navigations may occur within a single step. The load times for each navigation are summed per step, and then summed again for the entire transaction to calculate the total time.
An exception applies when a step does not include navigation (for example, a content check). In that case, the step time is 0 for W3C load event, while network time is based on the step’s execution time rather than network idle time.
Monitor results
When you enable any of the load time settings, the Check details page shows you the monitor results for this setting. For more detailed information, see Load times.