
The Full Page Check monitor with the browser type Chrome with extra metrics measures extra data for Core Web Vitals and W3C navigation timings. This data can now be shown on dashboards in a custom report tile of the type Simple data list / chart.
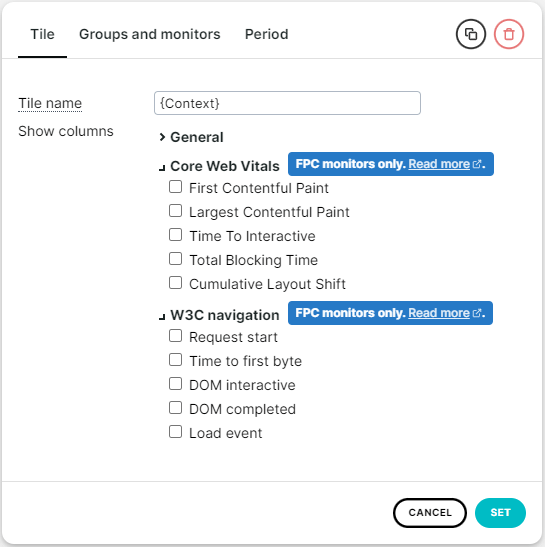
Open the tile’s settings by clicking the button and select the metrics you want to show on the tile.
Note: If an existing Full Page Check monitor was changed from another browser type to Chrome with extra metrics, the extra data (Core Web Vitals and W3C navigation timings) is not available for periods before that change and the chart or list will not show extra data. In the tile settings, select a different period that falls within the time after the monitor type was changed.