New: The State of API Reliability Report 2025 has landed.

Track your custom metric performance with minimum, average, and maximum values

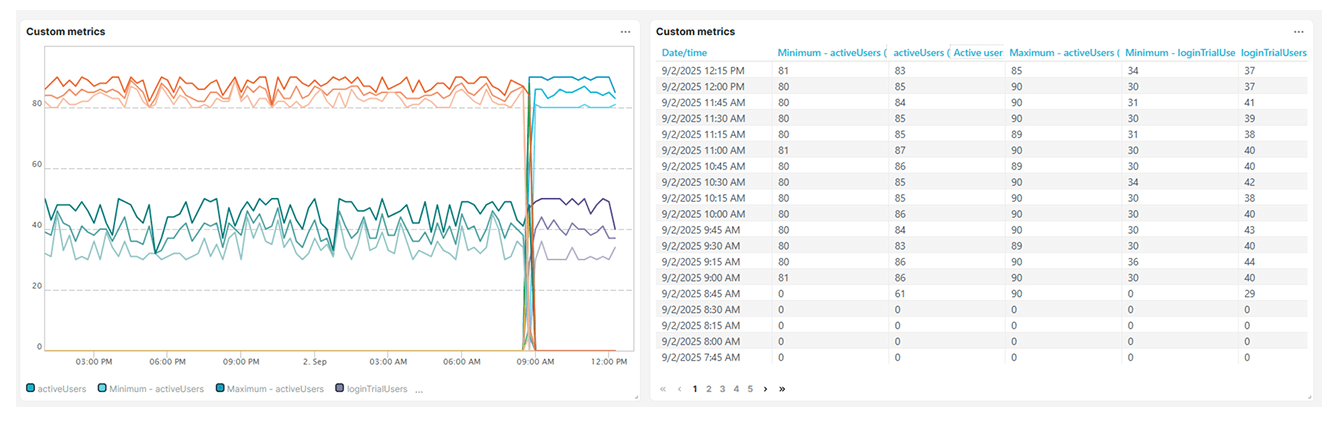
The Custom metrics list and chart now display the minimum and maximum values, alongside the average values already available for each metric. These values are color-coded and plotted on the diagram, making it easier to spot trends and compare performance over time.

Custom metric data with minimum, average, and maximum values

By using the Uptrends website, you consent to the use of cookies in accordance with our Cookie Policy.