Based on an initiative by Google to simplify the conversation about website optimization, Core Web Vitals are a set of key metrics to measure website performance. These metrics reflect different aspects of the user experience when visiting any site, such as loading speed and visual stability. Poor scores on such metrics may directly affect your search engine rankings, meaning it’s important to keep track of these key numbers, so you can ensure your page is and remains properly optimized.
Uptrends' Full Page Check (FPC) and transaction monitor types come with the option to display the set of Core Web Vitals (plus some additional information). This article will provide you with an overview of the metrics shown and what they mean exactly.
Metrics
Uptrends displays the following Core Web Vitals (and related metrics):
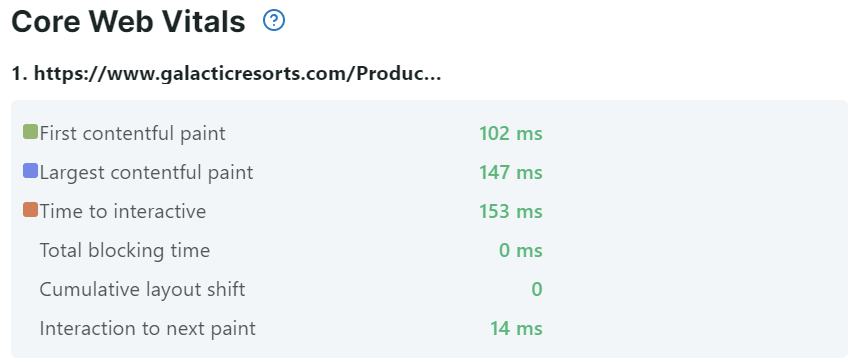
- First contentful paint (FCP): The FCP measures how long it took the browser to render the first content on the page.
- Largest contentful paint (LCP): The LCP measures the time when the largest single element (image or text block) was rendered on the page. It marks the point in the page load timeline when the page’s main (or largest) piece of content has started loading. The LCP and FCP can be the same, when the largest page element is the first one that loads.
- Time to interactive (TTI): The TTI is an indication of the time between the start of loading, and when the page can reliably respond to user inputs. As such, it’s a good way to measure how long the user actually ends up waiting for the page to load. It’s necessary to determine the TTI in order to calculate the Total blocking time.
- Total blocking time (TBT): TBT measures the amount of time the browser’s main thread is blocked . It counts the time where the browser has spent more than 50 milliseconds (ms) on handling a task that causes the page to respond slowly and block user interactions. For each long task, only the portion of time beyond the initial 50 ms is counted toward the TBT. Tasks that take 50 ms or less are not included in this metric.
- Cumulative layout shift (CLS): The CLS is one of the last metrics determined, after the page has finished loading completely. It describes the measure in which the page layout shifts (visible elements moving from one place to another) after the page has become interactable, indicating its visual stability.
- Interaction to next paint (INP): The INP is an indication of a page’s overall responsiveness to user interactions. It measures the the time between click or keyboard interactions with the page and any visual feedback. Because it requires page interactions beyond the initial page load, INP is available only for transaction monitors.
Dashboard reporting
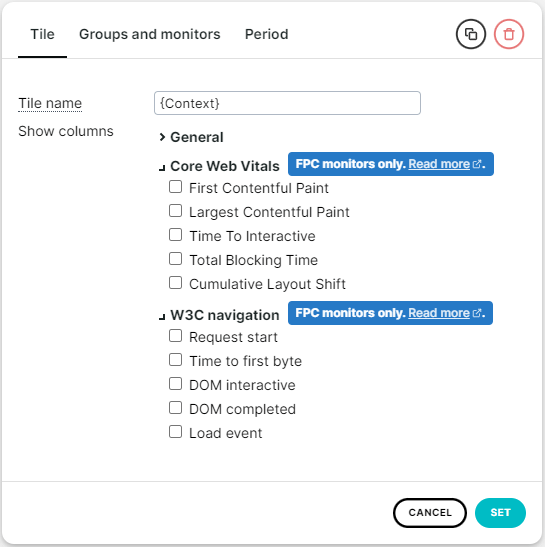
You can report all the metrics on a custom dashboard. Just add a custom dashboard tile of the type Simple data list / chart. Then click the settings button on the tile and choose the values you want to show by checking their check boxes.
You can show the Core Web Vitals of transactions for each individual step. You have to activate the Waterfall and the Performance metrics options for each step that you want to view in the graph. See the information on step settings for how this works.
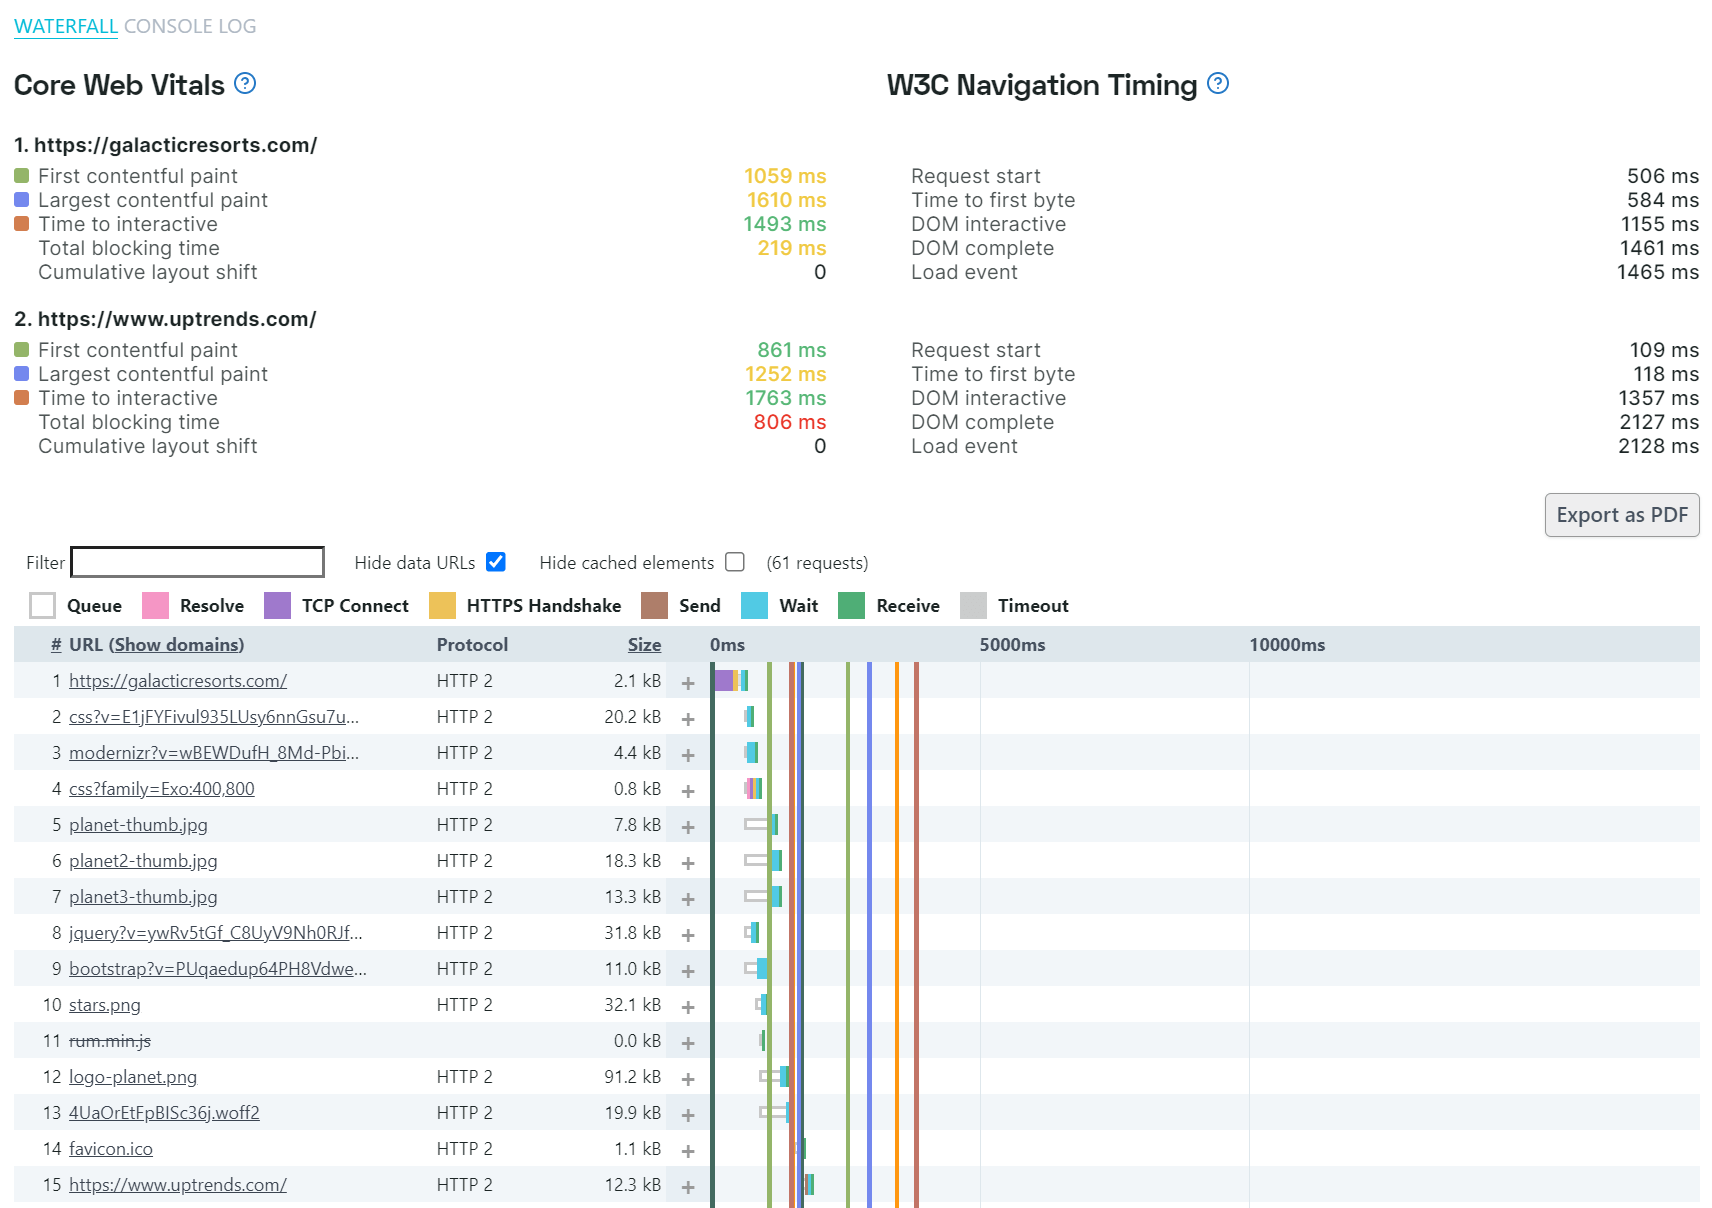
Core Web Vitals in Transaction monitors
A waterfall chart in a transaction monitor will display Core Web Vitals and W3C navigation timings. Uptrends will show the metrics for every specified navigation in a step.