The World Wide Web Consortium (or W3C for short) is an international organization, involved in developing standards for the world wide web. As such, it has defined a standard for browsers and web applications to generate and display timing information regarding the loading of webpages. The complete specification of the standard can be found on the W3C website (Copyright © 2012, World Wide Web Consortium).
Uptrends' Full Page Check (FPC) and transaction monitor types come with the option to display a subset of W3C navigation timing metrics (plus some additional information such as Core web vitals). This article will provide you with an overview of the metrics shown and what they mean exactly.
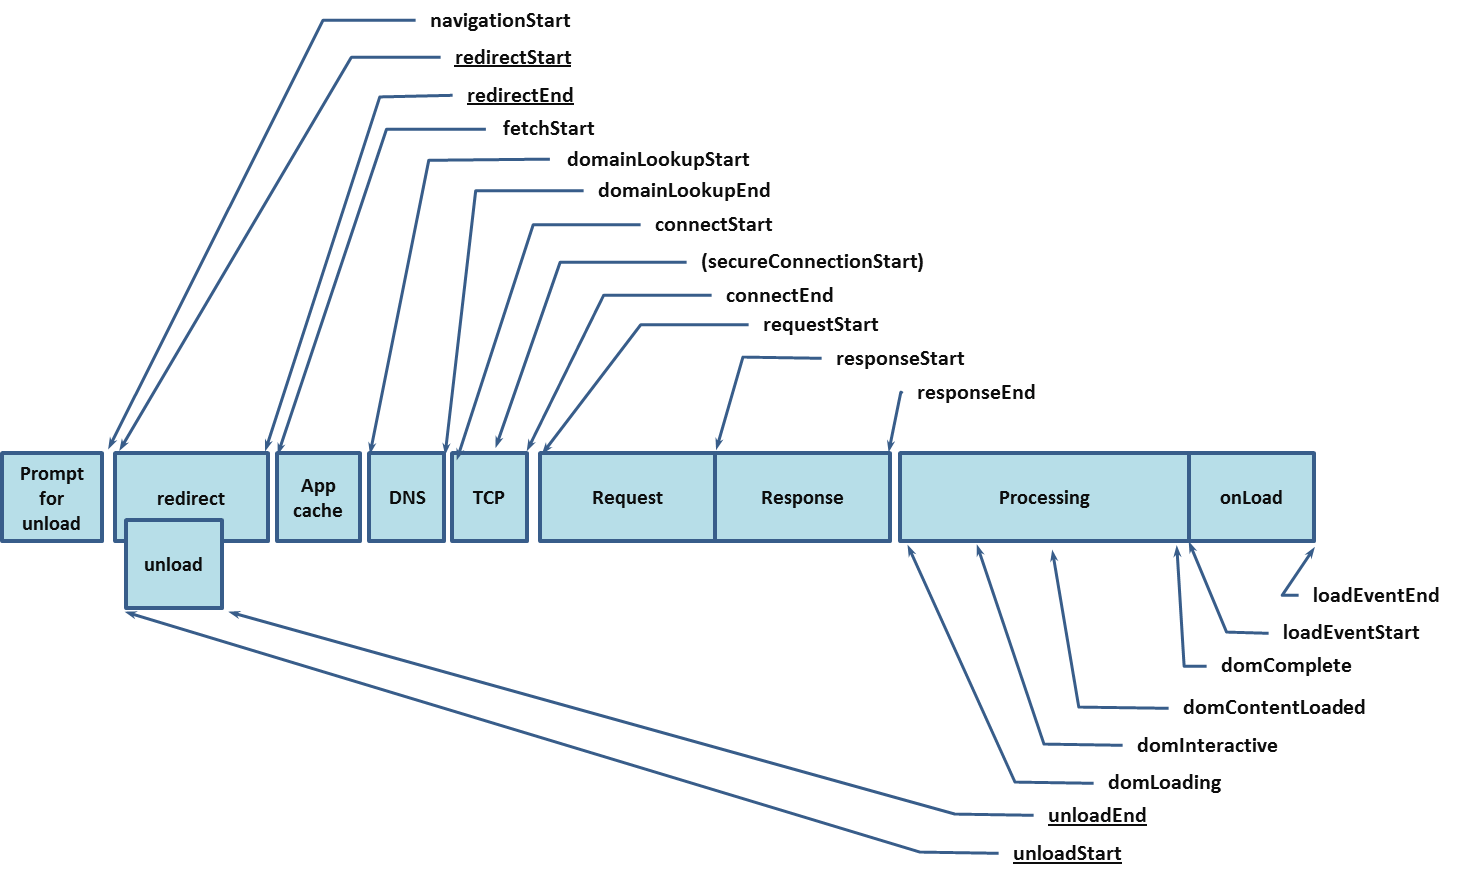
For illustration, the following image shows all navigation timing events as defined by the W3C, on a timeline.
 (Copyright © 2012,
World Wide Web Consortium)
(Copyright © 2012,
World Wide Web Consortium)
Metrics
This is an overview of the W3C navigation timing metrics you can find in Uptrends' Full Page Checks.
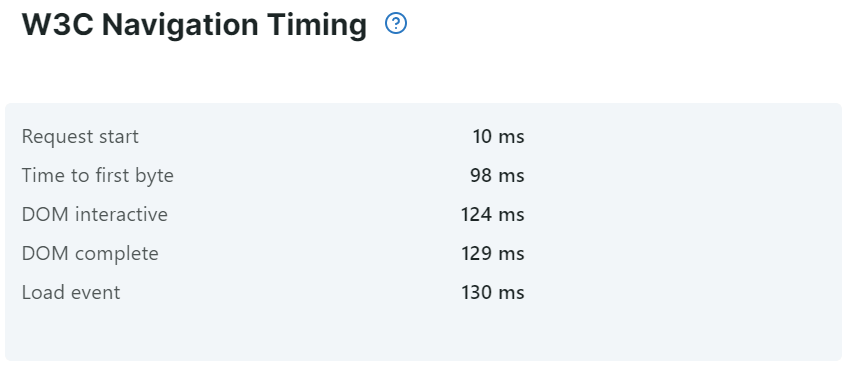
- Request start: Equal to the
requestStartas defined by the W3C. It is a timestamp indicating when the browser starts requesting the resource from the web server after the DNS lookup and TCP connection. - Time to first byte: Equal to the difference between
navigationStartandresponseStartas defined by the W3C. In short, it’s the time between when the first request was sent from browser to server, and when the first byte of the following response was received by the browser (this includes any redirects, and SSL/TCP connections). - DOM interactive: Equal to
domInteractiveas defined by W3c. It is a timestamp, indicating the document readiness is set to “interactive”, to indicate that the browser has stopped parsing the page and the user can start interacting with it. Resources such as scripts, images, stylesheets, or frames may still be loading. - DOM completed: Equal to the
domCompleteas defined by W3C. It is a timestamp, indicating when the main document has been parsed, the DOM has been fully loaded, and the page readiness is set to “complete”. - Load event: Equal to
loadEventEndas defined by W3C. It is a timestamp, indicating when the load event of the current document has completed, including all dependent resources such as stylesheets and images.
Dashboard reporting
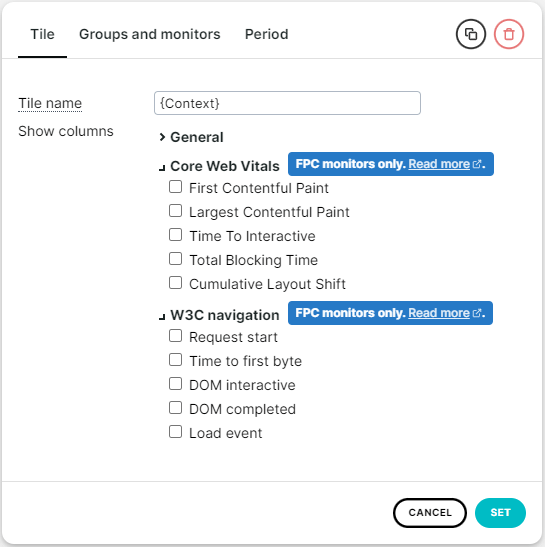
You can report all the metrics on a custom dashboard. Just add a custom dashboard tile of the type Simple data list / chart. Then click the settings button on the tile and choose the values you want to show by checking their check boxes.
You can show the W3C navigation metrics of a transaction monitor per individual step. You have to activate the Waterfall and the Performance metrics options for each step that you want to view in the graph. See the information on step settings for how this works.