
Dashboards are used to present all your monitoring data in an organized way. Dashboards contain tiles that show your data as lists or charts, or they show the latest results of a specific check. The Uptrends app comes with several predefined dashboards, but you can also define your own custom dashboards.
All dashboards can be accessed from the menu. In addition, specific dashboards can be opened from the corresponding main menu, e.g. the overview dashboard for your browser monitors can be opened from .
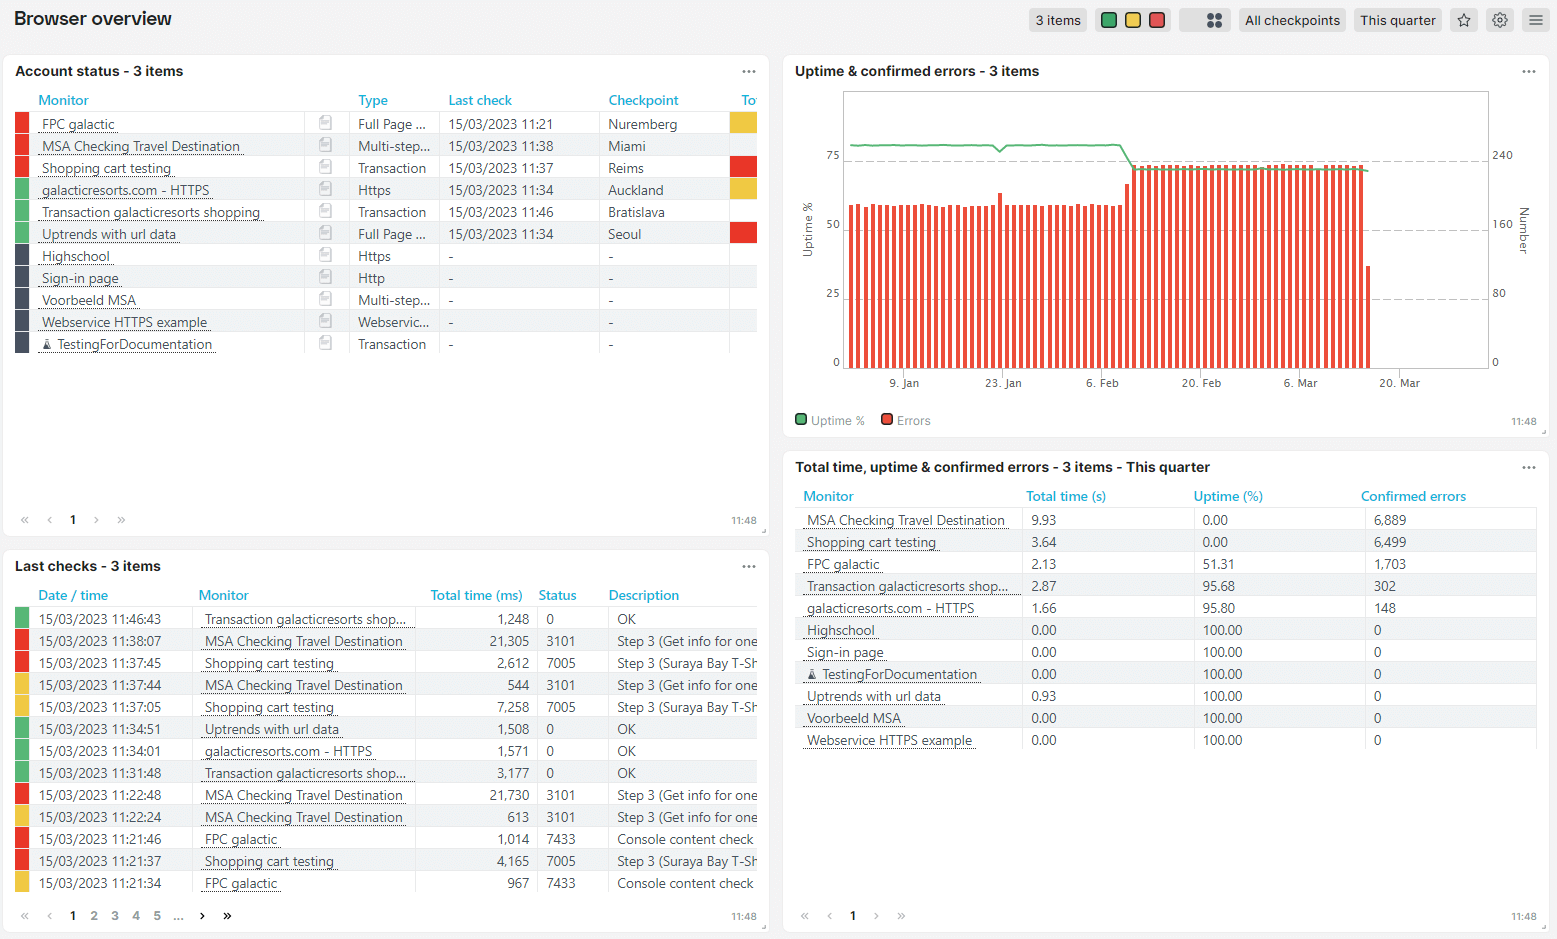
Predefined dashboards
There are a number of predefined dashboards for your convenience. The article Predefined dashboards has more information on which dashboards are readily available.
Custom dashboards and custom report tiles
In addition to the predefined dashboards you can also create custom dashboards and populate them with custom report tiles.
The dashboards can be customized by using custom names for the dashboard itself and the tiles, by choosing the metrics that are displayed in tiles, and by setting custom filters for the dashboard or individual tiles.
Filtering dashboard data
If you would like to use filters on your dashboard or individual tiles, check out our knowledge base article about filtering data on your dashboard for the filtering options.
Troubleshooting
Experiencing unexpected behavior? Here are some troubleshooting guides to help you:
- Missing data for newly created or modified monitors
- For newly created or modified monitors, the dashboard tile reflects the monitor data within 2 seconds. Once the initial data appears on the tile or five minutes have passed, the tile refreshes and retrieves new data every 30 seconds, following the standard loading time.
- Missing data in multi-checkpoint tiles
- Missing data in Full Page Check metric tiles